Frogger’s Adventure: The Rescue – Windows 7/10 Fix
In this post I’ll be going over the technical details behind the Frogger’s Adventure: The Rescue Compatibility Fix that Kneesnap and I recently released. I forget exactly how this adventure started, I believe Kneesnap had messaged me with a question about debugging or patching the game executable and mentioned he was trying to get this game to run on newer versions of Windows. Having never worked on a compatibility patch but interested in the idea I figured I would lend a hand, and I’m glad I did. We had to work through some pretty bugged code in the game and it really shows how cursed some game code can be.
Frogger’s Adventure: The Rescue came out in 2003 on Windows, Playstation 2, and Gamecube. It was one of over 2 dozen Frogger games, and if you haven’t played it, that’s okay, you’re not missing anything. The PC version of the game ran on Windows XP and was compatible with 98/95 as well. However, running it on anything newer that XP resulted in the game crashing.
Initial investigation
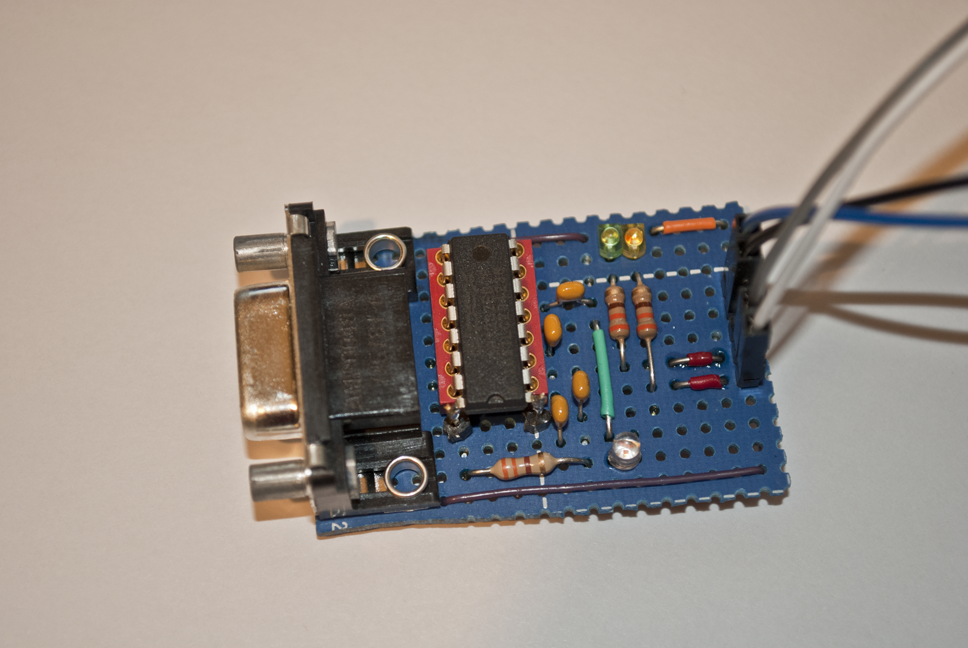
For testing I will be running the game on Windows 7, using WinDbg to debug and IDA to do reverse engineering. First thing to do was run the game under a debugger and see what was going on. Doing so brings us to the very first issue:
ModLoad: 729a0000 729c5000 C:\Windows\SysWOW64\powrprof.dll
ModLoad: 048e0000 04a01000 C:\Windows\SysWOW64\crypt32.dll
ModLoad: 03d70000 03d7c000 C:\Windows\SysWOW64\cryptbase.dll
ModLoad: 085a0000 091ec000 C:\Windows\SysWOW64\Shell32.dll
ModLoad: 03d70000 03d9f000 C:\Windows\SysWOW64\wintrust.dll
ModLoad: 67d30000 67dac000 C:\Program Files\NVIDIA Corporation\Ansel\NvCameraWhitelisting32.dll
winTIMER:Machine Frequency 3312871(Hz)
winTIMER:Function overhead = 0us
thread ID ————————: 20884
huTASK:buffer alloc size=16384
huMEM:Alloc Err (ReqSize=8192 Heap=0 MaxBlock=0)
(48d8.4b7c): Access violation – code c0000005 (first chance)
First chance exceptions are reported before any exception handling.
This exception may be expected and handled.
eax=00000000 ebx=7efde000 ecx=00f1e918 edx=00000080 esi=00000000 edi=00000000
eip=00418d72 esp=000cfeb8 ebp=000cfed0 iopl=0 nv up ei pl nz ac pe nc
cs=0023 ss=002b ds=002b es=002b fs=0053 gs=002b efl=00210216
FrogADV+0x18d72:
00418d72 83b87c5a030000 cmp dword ptr [eax+35A7Ch],0 ds:002b:00035a7c=????????
As we can see from the debugger output above we are getting an access violation trying to read 32bits at eax+0x35A7C, and the value of eax is 0. We have a null pointer deref. Going to the address of this cmp instruction, 0x00418d72, in IDA brings us to the following disassembly:
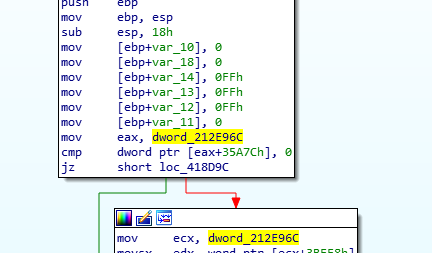
So eax is set to the value at 0x212E96C, and for some reason this variable was either never initialized, or set to null (maybe a memory allocation failed). The next step is to trace the xrefs on dword_212E96C and see where this variable is supposed to be set, which brings us here:
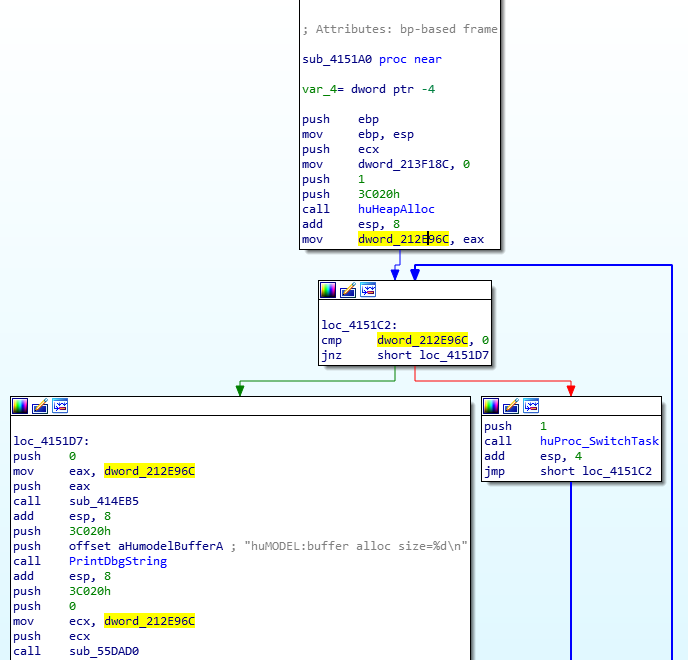
We can see that dword_212E96C was set to the return value from huHeapAlloc, which I named based on the debug print string I found in the function: “huMEM:Alloc Err (ReqSize=%d Heap=%d MaxBlock=%d)”. This seems to be a custom memory allocator that lets you specify a heap number to allocate from. This is a good indication that the game not only implements it’s own memory allocators, but that there is something wrong with it which is why we are getting a null allocation pointer. But why would a game implement its own memory allocator?
A short history lesson part 1
Many older games have their own memory alloc and free functions implemented by the game developers. The implementations for these can vary wildly from just wrapping normal malloc/free to doing more crazy things which we will see soon. Back in the early days of games developers had to manage all the memory themselves. Either because the platform or OS didn’t have fancy memory allocator functions or because the ones provided had issues. Writing custom memory allocators became second nature to early game developers, and when the platforms and OS’s became more robust and provided solid memory allocator functions, game devs continued to write their own and stayed stuck in their ways. This is something I have encountered in a number of older video games, and every implementation has had a bug somewhere in it.
Using custom memory allocators can also be used as a debugging technique to find memory leaks. By creating your own alloc and free functions you could easily track every allocation made and if it was free’d. Finding a memory leak becomes a lot easier when you could see a comprehensive list of every allocation that had not been free’d when cleaning up resources.
Failing memory allocations
Next we need to figure out what is wrong with this memory allocator. Looking at the code in the image above we can see that dword_212E96C is set to the value returned by huHeapAlloc. If the value is null it will get stuck in a loop since this is the only place that sets dword_212E96C in the game. If the value is not null we should see the debug string: “huMODEL:buffer alloc size=%d\n”
Looking back in the debugger output window I didn’t see this message anywhere, so either the allocation being returned is null, or this code is not being called. Placing a breakpoint on the call to huHeapAlloc and running the game results in us hitting the same access violation as before. So this code is never being called, and that’s why dword_212E96C is null.
Looking at the debug output window again I noticed a suspicious debug message being printed right before the access violation: “huMEM:Alloc Err (ReqSize=8192 Heap=0 MaxBlock=0)”
So it seems there is another allocation before the one we are currently investigating that is failing. Since the code for this “huMODEL” allocation is not getting called, it makes sense to start from wherever this huMEM alloc error message is being printed from.
Searching for that string in IDA brings us back to huHeapAlloc:
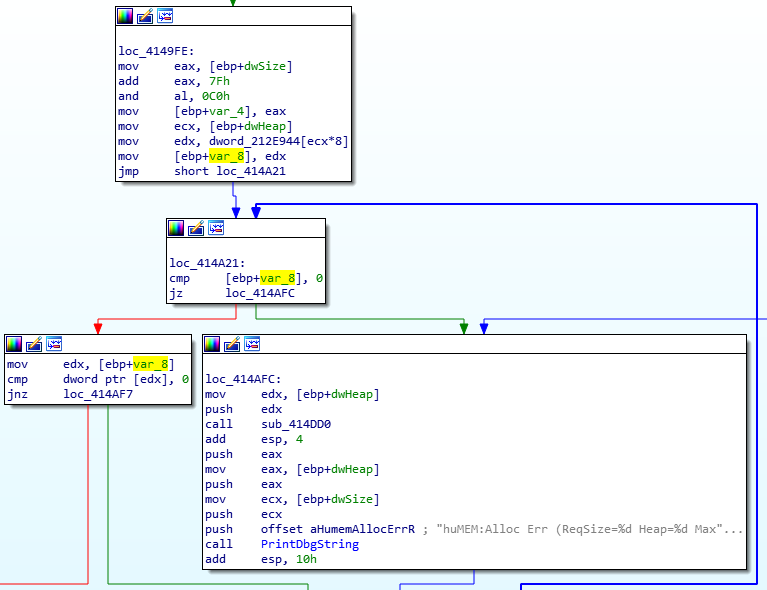
Looking at this function we can see a couple things. For one, we now know the parameters for this function are the allocation size (dwSize) and the heap index (dwHeap) to allocate from. We can also see that the dwHeap is used as an index into the dword_212E944 array, which is presumably an array that holds the base address for each heap region. Right after we get the heap base address we store it into var_8 and fall into a loop. This loop presumably walks the allocations list in the heap and looks for a free block large enough to hold dwSize bytes.
So one of two things could be happening here, either this heap was never allocated or it ran out of space and we can’t make the requested allocation. Either condition would cause us to hit the debug print and infinite while loop that follows it.
Walking the heap allocation list
We will need to do some debugging to figure out what is going on here. First lets find the caller of huHeapAlloc for the failing allocation. To do this we can breakpoint at loc_414AFC and walk the callstack 1 call back. This brings us to 0x0041CD14:
Next we will want to place a break point inside huHeapAlloc as it walks the heap allocation list so we can see what the list looks like for the allocation that fails. This will let us know if we are really out of memory or if the allocation list got corrupted.
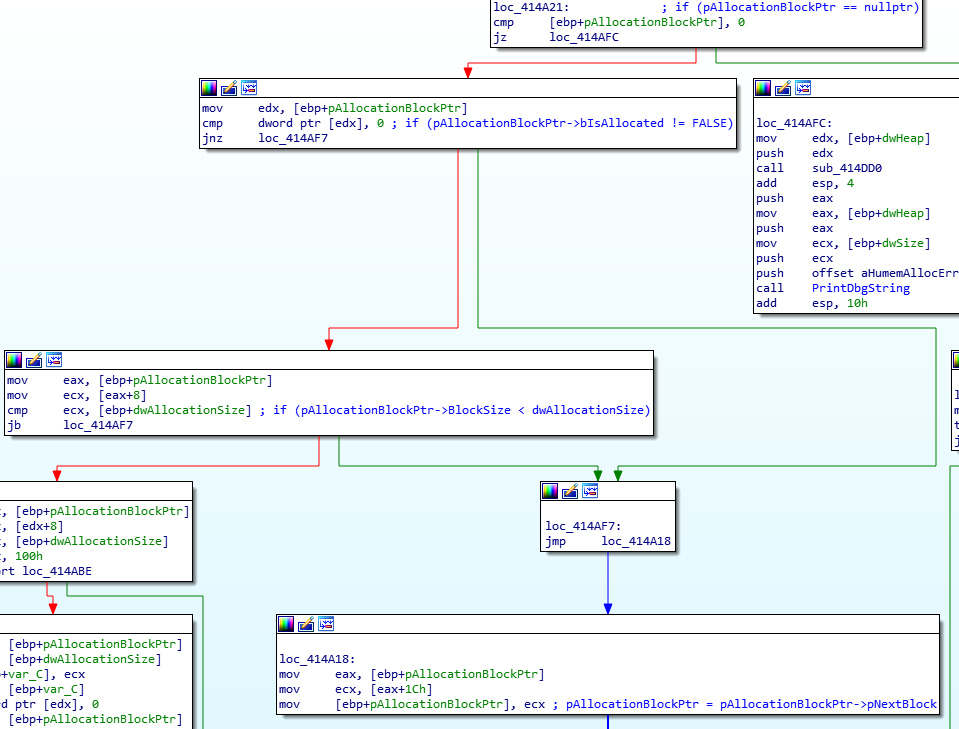
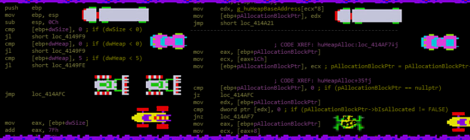
Looking at the disassembly above we can see how huHeapAlloc walks the allocation list. The pAllocationBlockPtr variable gets set to the base address for the specified heap region before falling into this loop. The disassembly for the loop translates into the following C code:
|
1 2 3 4 5 6 7 8 9 10 11 12 13 14 15 16 17 18 19 |
pAllocationBlockPtr = dword_212E944[dwHeap]; while (true) { if (pAllocationBlockPtr == nullptr) { // Error case, print debug message and loop infinitely. } if (pAllocationBlockPtr->bIsAllocated != FALSE || pAllocationBlockPtr->BlockSize < dwAllocationSize) { // Block is not available. pAllocationBlockPtr = pAllocationBlockPtr->pNextBlock; continue; } // Allocate data... } |
To debug this we are going to place 2 break points, one on the call to huHeapAlloc at 0x0041CD14, and one at loc_414A21 that will let us print the address of pAllocationBlockPtr. To do this we can use a breakpoint with a command attached to it:
ba 0x414A21 “?? (unsigned int)(@ebp – 8);g”
This says to place a breakpoint at address 0x414A21 and when it is hit print the 32bit value at ebp-8 and then continue execution, this will print the address of every allocation block in the heap.
With those breakpoints set all we need to do is wait until we hit the call to huHeapAlloc followed by the access violation and we will see what the allocation list looks like leading up to the failure. There are 2 hits for the first breakpoint, and then the access violation occurs, here is the debug output:
0041cd14 e8c87cffff call FrogADV+0x149e1 (004149e1)
0:000> g
unsigned int 0xb7d00
unsigned int 0
huMEM:Alloc Err (ReqSize=8192 Heap=0 MaxBlock=0)
(43f8.1ef8): Access violation – code c0000005 (first chance)
First chance exceptions are reported before any exception handling.
This exception may be expected and handled.
eax=00000000 ebx=7efde000 ecx=00f1e918 edx=00000080 esi=00000000 edi=00000000
eip=00418d72 esp=000cfeb8 ebp=000cfed0 iopl=0 nv up ei pl nz ac pe nc
cs=0023 ss=002b ds=002b es=002b fs=0053 gs=002b efl=00210216
FrogADV+0x18d72:
00418d72 83b87c5a030000 cmp dword ptr [eax+35A7Ch],0 ds:002b:00035a7c=????????
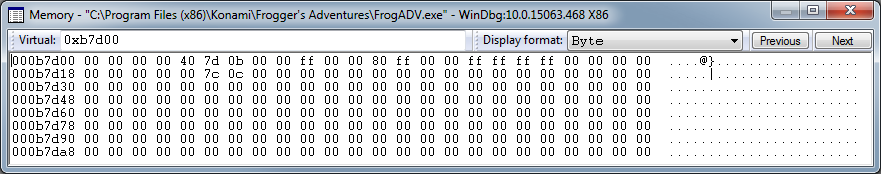
Huh, so this is strange, it looks like there is only one allocation in the list before pAllocationBlockPtr gets set to 0. Lets take a look at the allocation list before this loop executes. This time we will place a breakpoint on the call to huHeapAlloc at 0x0041CD14, and once it gets hit the second time we will place a breakpoint on loc_414A21. Once the second breakpoint hits we can get the address of pAllocationBlockPtr by running the following command:
?? (unsigned int)(@ebp-8)
This will print the value of pAllocationBlockPtr, and by going to that address in the memory view we can see the data for this heap:
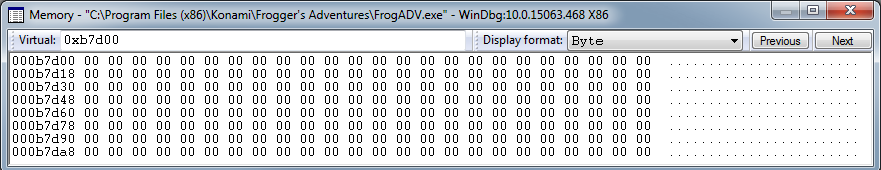
As we can see the data for the allocation list is all 00s. Even if nothing was allocated from this heap yet we should still see some meta data indicating the size of the heap at 0xB7d00+8, yet it’s all 00s. This could be an indication that we have some memory corruption going on here. To find out for sure we will need to find the code that initializes this heap region, make sure it’s getting initialized okay, and then place a data breakpoint to figure out who is trashing our data.
Tracing memory corruption
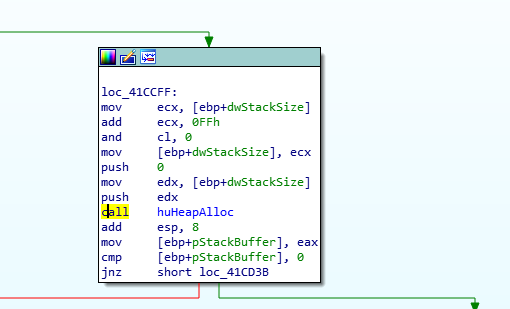
Looking back at huHeapAlloc we know that dword_212E944 is an array for the base address of each heap region. There’s only 1 xref that performs a non-zero write to this array and that’s at 0x00414946. Looking at this function we can see there is a loop that loops 5 times, once for each heap region. We’re going to call this function huMemInitialize. Since the heap we are interested in is index 0, lets place a breakpoint at 0x00414946, and when it hits inspect the heap to make sure it was initialized successfully.
Aha, so the heap is being initialized successfully which means we most likely have some data corruption going on. Lets place a data breakpoint at 0xb7d00+8 using the following command to catch whoever is trashing this data:
ba w 4 0xb7d08
The first hit we get is from a move instruction and it appears to be from a valid allocation that is being made. This is not what we are looking for so lets continue and see if we get another hit:
Breakpoint 1 hit
eax=000b7d08 ebx=023e0000 ecx=00000001 edx=50000163 esi=00000000 edi=00000000
eip=77572400 esp=000b7bc4 ebp=000b7c94 iopl=0 nv up ei pl nz na pe nc
cs=0023 ss=002b ds=002b es=002b fs=0053 gs=002b efl=00200206
ntdll!RtlpAllocateHeap+0x9a:
77572400 817d08ffffff7f cmp dword ptr [ebp+8],7FFFFFFFh ss:002b:000b7c9c=0000021a
The output above is slightly misleading in that the cmp instruction it reports is actually the next instruction after the write was hit. The real instruction that triggered the write is a mov instruction in ntdll!RtlpAllocateHeap:
mov dword ptr [eax],4
We can see eax=0xb7d08 which is our heap address, but why in the world is RtlpAllocateHeap trying to write to this address? Lets run !address on our heap address to see what the state of this memory region is:
0:000> !address 0xb7d08
Usage: Stack
Base Address: 000b7000
End Address: 000d0000
Region Size: 00019000 ( 100.000 kB)
State: 00001000 MEM_COMMIT
Protect: 00000004 PAGE_READWRITE
Type: 00020000 MEM_PRIVATE
Allocation Base: 00090000
Allocation Protect: 00000004 PAGE_READWRITE
More info: ~0k
Content source: 1 (target), length: 2f8
So according to !address our heap region is actually part of the stack for the thread we are running on. This doesn’t really make any sense because it would mean that the game’s custom memory allocator is actually allocating stuff on the stack for long term use. Just to confirm this is correct lets run !kn and to see the call stack and check against the stack frame addresses:
0:000> kn
# ChildEBP RetAddr
00 000b7c94 77553441 ntdll!RtlpAllocateHeap+0x9a
01 000b7d18 775f0f23 ntdll!RtlAllocateHeap+0x23a
02 000b7d64 775aaaa7 ntdll!RtlDebugAllocateHeap+0xb5
03 000b7e48 77553441 ntdll!RtlpAllocateHeap+0xc4
04 000b7ecc 7755a110 ntdll!RtlAllocateHeap+0x23a
05 000b8134 775619b8 ntdll!RtlpDosPathNameToRelativeNtPathName_Ustr+0x97
06 000b8150 77561a28 ntdll!RtlDosPathNameToNtPathName_Ustr_WithStatus+0x18
07 000b81b4 77562b25 ntdll!LdrpResolveFileName+0x5a
08 000b8218 77561d49 ntdll!LdrpSearchPath+0x19d
09 000b8310 7755e956 ntdll!LdrpFindOrMapDll+0x209
0a 000b849c 7759d39f ntdll!LdrpLoadDll+0x2d6
0b 000b84d8 755d2e0f ntdll!LdrLoadDll+0xc7
0c 000b8520 5bc0e42a KERNELBASE!LoadLibraryExW+0x233
….
25 000ba828 100561d8 d3d8!Direct3DCreate8+0x124
It’s confirmed, our “heap” is actually part of the stack region for the thread we are executing on, and the memory corruption occurred because the callstack was so deep that we overwrote the allocations list for our “heap” and corrupted it. The stack is not intended for long term memory allocations and doing so is very bad practice and prone to errors like we are currently experiencing.
You kids get off my stack
Now we need to figure out how the base address for the heap region is chosen, and we will most likely need to patch the code to call a real memory allocation function instead. Here is the rough C code for the huMemInitialize:
|
1 2 3 4 5 6 7 8 9 10 11 12 13 14 15 16 17 |
BOOL huMemInitialize() { PrintDbgString("huMEM:MCB Size=%d\n", 0x40); // g_huHeapRegionAddresses[5] = { 0x1D1E940, 0x109E940, 0xF1E940, 0x101E940, 0x1D2E940 } // g_huHeapRegionSizes[5] = { 0x10000, 0xC80000, 0x100000, 0x80000, 0x400000 } g_huHeapRegionAddresses[0] = sub_415119(0x10000); for (int i = 0; i < 5; i++) { HeapInitialize(g_huHeapRegionAddresses[i], g_huHeapRegionSizes[i]); g_huHeapBaseAddress[i] = g_huHeapRegionAddresses[i]; } return TRUE; } |
Looking at the data for g_huHeapRegionAddresses the first heap base address is set to 0x1D1E940, however, huMemInitialize is overwriting this with the return value from sub_415119. So whatever this function is doing it’s returning a stack address, lets take a look:
|
1 2 3 4 5 6 7 8 9 10 11 12 13 14 15 16 17 |
void * sub_415119(DWORD size) { sub_415141(size + 0x8000); return dword_212E968; } void sub_415141(DWORD size) { void *pBaseAddress = alloca(0x1008); *(BYTE*)(pBaseAddress + 0xFFF) = 0; if (size - 0x1000 > 0) sub_415141(size - 0x1000); if (dword_212E968 == 0) dword_212E968 = pBaseAddress; } |
Aha, so this function is calling alloca() to allocate long term memory, this explains everything. The alloca() function is used to allocate more stack space for the function that is currently executing, it’s only valid so long as the function that called alloca() doesn’t return. This is actually a fancy compiler intrinsic. When the compiler sees this it knows to adjust the stack pointer by adjusting esp by the allocation size. For the rest of the function the compiler will adjust the offset of every stack variable to account for the change in stack size. Once the sub_415141 returns the stack frame is destroyed and so is the alloca() allocation. Because this memory is being used way after sub_415141 has executed, it is no longer valid and makes perfect sense why we are seeing memory corruption on the stack.
There is an easy fix for this, we can simply patch sub_415141 to call an allocator like VirtualAlloc to allocate memory from the process heap rather than the stack. We don’t really need to worry about freeing this memory as it’s only some 0x10000 bytes that are being allocated for the entire fake heap region. Here is the assembly we are going to patch it with:
|
1 2 3 4 5 6 7 8 9 10 11 12 13 14 15 16 17 18 |
; Allocate memory. push 4 ; PAGE_READWRITE push 01000h ; MEM_COMMIT push dword [esp+4+8] ; Allocation size push 0 ; Allocation address mov eax, dword [VirtualAlloc] call eax ; Check if the allocation pointer has been setup yet or not. cmp dword [AllocationPtr], 0 jnz _done ; Set the allocation pointer. mov dword [AllocationPtr], eax _done: ; Return ret |
Running the game with the memory allocation patch gives us some interesting results:
huMEM:MCB Size=64
Heap Initialize $022F0040-$022FFF40 ( 63KB)
Heap Initialize $0109E980-$01D1E8C0 ( 12799KB)
Heap Initialize $00F1E980-$0101E8C0 ( 1023KB)
Heap Initialize $0101E980-$0109E8C0 ( 511KB)
Heap Initialize $01D2E980-$0212E8C0 ( 4095KB)
huPROC:buffer alloc size=832
…
(1360.1a20): Access violation – code c0000005 (first chance)
First chance exceptions are reported before any exception handling.
This exception may be expected and handled.
WARNING: Stack pointer is outside the normal stack bounds. Stack unwinding can be inaccurate.
eax=00000000 ebx=00000001 ecx=00001a20 edx=40000062 esi=02380000 edi=0000021a
eip=775f08f8 esp=022f0000 ebp=022f001c iopl=0 nv up ei pl nz na po nc
cs=0023 ss=002b ds=002b es=002b fs=0053 gs=002b efl=00210202
ntdll!RtlpValidateHeap+0xa:
775f08f8 57 push edi
WARNING: Stack pointer is outside the normal stack bounds. Stack unwinding can be inaccurate.
WARNING: Stack pointer is outside the normal stack bounds. Stack unwinding can be inaccurate.
0:000> kn
WARNING: Stack pointer is outside the normal stack bounds. Stack unwinding can be inaccurate.
# ChildEBP RetAddr
00 022f001c 775f0f19 ntdll!RtlpValidateHeap+0xa
01 022f0064 775aaaa7 ntdll!RtlDebugAllocateHeap+0xab
02 022f0148 77553441 ntdll!RtlpAllocateHeap+0xc4
03 022f01cc 7755a110 ntdll!RtlAllocateHeap+0x23a
04 022f0434 775619b8 ntdll!RtlpDosPathNameToRelativeNtPathName_Ustr+0x97
05 022f0450 77561a28 ntdll!RtlDosPathNameToNtPathName_Ustr_WithStatus+0x18
06 022f04b4 77562b25 ntdll!LdrpResolveFileName+0x5a
07 022f0518 77561d49 ntdll!LdrpSearchPath+0x19d
08 022f0610 7755e956 ntdll!LdrpFindOrMapDll+0x209
09 022f079c 7759d39f ntdll!LdrpLoadDll+0x2d6
0a 022f07d8 755d2e0f ntdll!LdrLoadDll+0xc7
0b 022f0820 5bc0e42a KERNELBASE!LoadLibraryExW+0x233
…
24 022f2b28 100561d8 d3d8!Direct3DCreate8+0x124
Looking at the output we see a few things:
- The stack pointer is actually in our huHeap 0 region, meaning we are not executing on the stack and some how the stack pointer got changed.
- We have hit an almost identical access violation, same function, call stack leading up to it is almost identical too.
- The access violation occurred on a push instruction, and the only way this can happen is if we reached the top of the stack and hit a guard page or unallocated memory.
- There are some warnings about the stack pointer being outside of the bounds of the stack.
- The last game message that was printed before the access violation was “huPROC:buffer alloc size=832“, which may help us later on
So this means that the stack pointer is actually being changed to point into our huHeap 0 region. This is bad because not only are we running out of “stack” space but we are using the heap as a stack and this is very bad practice. This is the result of us patching the memory allocator, remember it was using alloca() before we changed it to use VirtualAlloc. So we introduced the issue of using the heap as a stack, but we are still running out of “stack” space and causing an access violation.
Given these circumstances and the debug message “huPROC:buffer alloc size=832” it made me start to think that perhaps we are looking at a task system that is designed to work as a poor man’s replacement for threading. Searching the strings view in IDA for “huPROC” will give us a few interesting results:
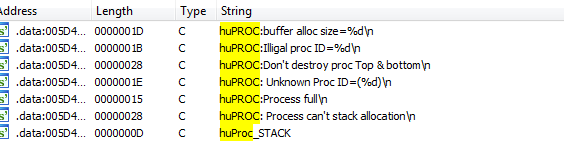
These strings definitely make it seem like we are looking at a task system. Spoiler alert: it is. I spent a few hours reverse engineering all the huPROC functions that make up the tasks system. I’m not going to cover the reverse engineering process but I will go over the technical details for the huPROC system below. Now we know this is a task system. But why would the developers create their own task system that works by segmenting the stack for a single thread instead of just using multiple threads?
A short history lesson part 2
Before the age of multi-core and multi-hardware thread processors CPUs only had one core or one hardware thread. This means that it can only physically execute one thing at a time. Multi-threading still exists on these CPUs but it is all software based, and only one thread can be executing at any given time. Older consoles like PS1 and N64 have CPUs that only have one hardware thread but still support multi-threading via software.
The way this works is you have a number of software “threads” that each have their own stack region and processor context. One thread will execute for some duration of time before it gets interrupted, and another thread is given execution time. This interruption can either be an OS level thread scheduler or the developer can call some API that yields the currently executing thread, allowing another thread to get execution time. Modern processors now have multiple physical cores, and some of these cores have more than 1 hardware thread. Xbox 360 for example, has a 3 core processor with each core having 2 hardware threads, for a total of 6 hardware threads that can execute simultaneously.
Developers on older consoles had to depend entirely on software threading, and in some cases use other co-processors the console had to perform tasks for them. This produced some very amazing and some very poor multi-tasking systems depending on the skill level of the developer.
In the case of Frogger’s Adventure: The Rescue I suspect that this engine is actually from a previous game that was developed on a console or handheld that only had a single hardware thread. In order to get multi-threading functionality the huPROC task system was created. Later on the same engine was used for this game and instead of changing the task system to use windows threading APIs, they just left it as-is since it worked on XP and below.
How does huPROC work
The huPROC task system is a software implementation of multi-threading. It divides up the stack for the running thread into different sub-regions for the task workers, only one of which can run at any given time. Each worker has it’s own register state, and will execute some task before yielding to the next worker in the list. There are different workers for various operations such as UI + DirectX init, loading game files, processing audio buffers, etc.. The huPROC task system has several core functions used for creating, running, switching, and destroying tasks:
- huProc_CreateTask – Creates a new task for the given worker function. The task is added to the tasks list and assigned a new task id.
- huProc_DestroyTask – Stops a task from executing and marks it for cleanup.
- huProc_DispatchHelper – Entry point for all tasks, calls the task’s function handler and then destroys the task should the function handler return. Think of it like a thread entry point.
- huProc_SwitchTask – Creates a setjmp block for the current task and longjmps to the huProc_TaskWorker restore point.
- huProc_TaskWorker – Loops through the list of tasks and gives each one execution time. Calling huProc_SwitchTask will longjmp back to this restore point for the next loop iteration.
Task switching works by using setjmp and longjmp, which are C functions for saving and restore register state for the current thread, you can use them to jump around the callstack in a pretty dangerous way. I’ve never seen an acceptable time to use these functions, and every time I have seen them was a work around for a bug the developers neglected to fix. Overall they should never really be used.
Using these in pairs allows for switching from the main task to any child task, and back, while on a single thread. The main game task will loop and process child tasks as part of the game’s render loop. The child tasks will perform various operations and switch back to the main task once done.
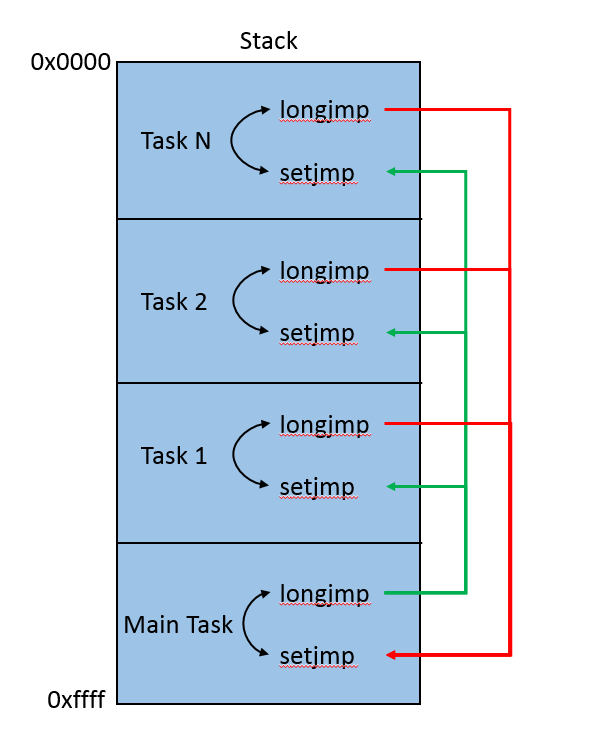
The diagram above is a visual representation of how the huPROC system divides up the stack for the current thread into smaller regions that it can use for each task. The main task runs inside of the game’s render loop and every frame it gives each child task execution time. The task switch is done by longjmp’ing to the child task as indicated by the green arrows. The child task will perform whatever actions it needs and then longjmp back to the main task as indicated by the red arrows.
All of this happens on a single thread, and the problem we are running into is that one of the tasks is overflowing its stack sub-region and corrupting data for other tasks, as well as the huHeap allocation metadata that exists in-between each sub-region. This is what causes the huHeapAlloc call to fail. The task that’s causing this problem is responsible for initializing DirectX. So what changed between XP and Windows 7+ that causes an increase in the call graph for initializing DirectX? Looking at the faulting call stack for the access violation will answer that for us:
0:000> kn
# ChildEBP RetAddr
00 022f001c 775f0f19 ntdll!RtlpValidateHeap+0xa
01 022f0064 775aaaa7 ntdll!RtlDebugAllocateHeap+0xab
02 022f0148 77553441 ntdll!RtlpAllocateHeap+0xc4
03 022f01cc 7755a110 ntdll!RtlAllocateHeap+0x23a
04 022f0434 775619b8 ntdll!RtlpDosPathNameToRelativeNtPathName_Ustr+0x97
05 022f0450 77561a28 ntdll!RtlDosPathNameToNtPathName_Ustr_WithStatus+0x18
06 022f04b4 77562b25 ntdll!LdrpResolveFileName+0x5a
07 022f0518 77561d49 ntdll!LdrpSearchPath+0x19d
08 022f0610 7755e956 ntdll!LdrpFindOrMapDll+0x209
09 022f079c 7759d39f ntdll!LdrpLoadDll+0x2d6
0a 022f07d8 755d2e0f ntdll!LdrLoadDll+0xc7
0b 022f0820 5bc0e42a KERNELBASE!LoadLibraryExW+0x233
0c 022f0844 5bc0e4f0 nvd3dum!QueryOglResource+0x22fe2a
0d 022f0860 5bc0e313 nvd3dum!QueryOglResource+0x22fef0
0e 022f0884 5bc110e4 nvd3dum!QueryOglResource+0x22fd13
0f 022f0ad0 5bc11218 nvd3dum!QueryOglResource+0x232ae4
10 022f0b0c 5bc1dba4 nvd3dum!QueryOglResource+0x232c18
11 022f1280 5bc1e0ea nvd3dum!QueryOglResource+0x23f5a4
12 022f12b8 5bc1dcf5 nvd3dum!QueryOglResource+0x23faea
13 022f12e8 5bc1de82 nvd3dum!QueryOglResource+0x23f6f5
14 022f1314 5bc2e7c9 nvd3dum!QueryOglResource+0x23f882
15 022f1328 5bc291d7 nvd3dum!QueryOglResource+0x2501c9
16 022f1364 5bc291ac nvd3dum!QueryOglResource+0x24abd7
17 022f1374 5b9cec2e nvd3dum!QueryOglResource+0x24abac
18 022f1398 77559344 nvd3dum+0x8dec2e
19 022f13b8 7755fde1 ntdll!LdrpCallInitRoutine+0x14
1a 022f14ac 7755ea5e ntdll!LdrpRunInitializeRoutines+0x26f
1b 022f1620 7759d39f ntdll!LdrpLoadDll+0x472
1c 022f165c 755d2e0f ntdll!LdrLoadDll+0xc7
1d 022f16a4 76e148dc KERNELBASE!LoadLibraryExW+0x233
1e 022f16b8 6063a2bf kernel32!LoadLibraryW+0x11
1f 022f1a18 6062e3bf d3d8!Direct3DCreate8+0x1077f
20 022f228c 606308d5 d3d8!Direct3DCreate8+0x487f
21 022f25a0 60631b0c d3d8!Direct3DCreate8+0x6d95
22 022f25cc 60629057 d3d8!Direct3DCreate8+0x7fcc
23 022f2ae4 60629c64 d3d8!DebugSetMute+0x2447
24 022f2b28 100561d8 d3d8!Direct3DCreate8+0x124
The callstack is a mile long, and this task was only given a stack size of 0x2000 bytes to work with. Subtracting the stack frame address for frame 0 from frame 25 gives us some 0x2B0C bytes of stack space consumed before hitting the access violation. That’s out of bounds by almost an entire page of memory. So what changed?
The DirectX layer and display drivers. Back on Windows XP and below both DirectX and display drivers were pretty basic, and did not produce very large call graphs. Nowadays DirectX and display drivers have gotten very complex with all the features and complexities that have been added over the years (~17 years of innovation). This resulted in the call graph for functions like Direct3dCreate8 to increase, so much so that what was an acceptable amount of stack space for calling this function is no longer enough. So how can we fix this?
Redesigning huPROC
In order to fix this issue we will need to redesign the huPROC system, but that’s fine, I’m not a fan of using longjmp and setjmp anyway. For this redesign we will use real threads and a set of events to signal when they should start running and when they complete. The entire system will still run synchronously, that is, only one task will execute at any given time. It defeats the purpose of using multiple threads but we need a better way to give these tasks stack space of their own, and the best way to do that is with real threads.
For this redesign we are going to use dll injection and detours to inject our own dll into the game process and hook the huPROC functions. From there we can re-implement them in C instead of assembly and make this a lot easier to develop and debug. Plus there might be other things we need to fix later on so this will provide a good base for doing so.
First thing we need to do is create a thread info structure that we can use to track the event handles for each worker thread. We will need a place to store this thread info structure for each task. Since we changed the memory allocator for the task stacks to use VirtualAlloc and since we will no longer be using this memory for anything once we switch to real threads, this works out as the perfect place to store the the thread info data. Below is the huTask structure the game uses to track the tasks, and our huTaskThreadInfo structure we will use to track the info for each thread. This structure will exist in the memory pointed to by the StackAllocation field in huTask.
|
1 2 3 4 5 6 7 8 9 10 11 12 13 14 15 16 17 18 19 20 21 22 23 24 25 26 27 |
// sizeof = 0x68 struct huTask { /* 0x00 */ _JUMP_BUFFER RegisterState; /* 0x40 */ huTask *pBLink; /* 0x44 */ huTask *pFLink; /* 0x48 */ WORD Flags; /* 0x4A */ WORD Unk3; /* 0x4C */ WORD Unk1; /* 0x4E */ WORD ProcessId; /* 0x50 */ WORD ParentProcessId; /* 0x52 */ WORD Unk2; /* 0x54 */ int TaskStatus; // Gets set to 0xFFFFFFFF on task exit /* 0x58 */ huTask_WorkProc pFunction; /* 0x5C */ void *pUnkFunc; // another function pointer /* 0x60 */ DWORD StackSize; /* 0x64 */ void *StackAllocation; }; static_assert(sizeof(huTask) == 0x68, "huTask incorrect struct size"); struct huTaskThreadInfo { HANDLE hThread; // Worker thread handle DWORD ThreadId; // Worker thread id HANDLE hWorkerRunEvent; // Signaled when the worker should wake and do work HANDLE hWorkerSleepEvent; // Signaled when the worker has gone to sleep and a new task should be scheduled }; |
The idea is simple, every thread has 2 event handles, one for telling it to wake up and do work, and one to tell the main thread that the work has completed. When the main task executes huProc_TaskWorker it will loop through all of the tasks in the task list. For each one it will wake up the worker thread by signaling the hWorkerRunEvent, and then sleep until the worker signals the hWorkerSleepEvent. This is quite possibly the worst use of threads in the history of threading, I know, but I’m placing all blame on whoever came up with this absolutely cursed huProc task system.
Next we need to add some code to huProc_CreateTask so we can create the worker thread and the event handles for signaling. There is actually a function that huProc_CreateTask calls that does absolutely nothing and provided a nice place to hook at:
|
1 2 3 4 5 6 7 8 9 10 11 12 13 14 15 16 17 18 19 20 21 22 23 24 |
void __cdecl Hook_huProc_UselessTaskCreateFunc(void *pStackBuffer) { // Treat the stack buffer as storage for thread info. huTaskThreadInfo *pThreadInfo = (huTaskThreadInfo*)pStackBuffer; // Create the thread worker events. pThreadInfo->hWorkerRunEvent = CreateEventA(NULL, TRUE, FALSE, NULL); pThreadInfo->hWorkerSleepEvent = CreateEventA(NULL, TRUE, TRUE, NULL); if (pThreadInfo->hWorkerRunEvent == NULL || pThreadInfo->hWorkerSleepEvent == NULL) { // Failed to create thread worker events. OutputDebugString(L"Hook_huProc_UselessTaskCreateFunc(): failed to create thread worker events!\n"); DebugBreak(); } // Create the worker thread. pThreadInfo->hThread = CreateThread(NULL, NULL, (LPTHREAD_START_ROUTINE)huProc_ThreadWorker, pThreadInfo, NULL, &pThreadInfo->ThreadId); if (pThreadInfo->hThread == NULL) { // Failed to create worker thread. OutputDebugString(L"Hook_huProc_UselessTaskCreateFunc(): failed to create worker thread!\n"); DebugBreak(); } } |
Now every time huProc_CreateTask is called we will create a new thread just for that task, it will have it’s own stack and event handles to signal back to the main thread when it’s done doing work. We’ll need to change the huProc_ThreadWorker function so that it sleeps until the hWorkerSleepEvent is signaled, before calling the task’s work function. Remember in the old task system once the task is created it wont execute until the huProc_TaskWorker function is called. When we create the worker thread in the new system it will run immediately, so we need to stall it until it is signaled to do work.
|
1 2 3 4 5 6 7 8 9 10 11 12 13 14 15 16 17 18 19 |
DWORD huProc_ThreadWorker(huTaskThreadInfo *pThreadInfo) { // Reset the sleep function so huProc knows we are asleep. ResetEvent(pThreadInfo->hWorkerSleepEvent); // Sleep and wait for the work signal. WaitForSingleObject(pThreadInfo->hWorkerRunEvent, INFINITE); // Call the worker function, this will either call SwitchTask() or DestroyTask, either way we will catch // both and handle accordingly. (*g_huProcCurrentTask)->pFunction(); // Destroy the task. huProc_DestroyTask((*g_huProcCurrentTask)->ProcessId); // Switch task in case destroy task did not kill us. huProc_SwitchTask(0xFFFFFFFF); return 0; } |
That takes care of creating and starting a task, now we need to change huProc_DestroyTask so that if the task we are destroying is the one that is currently running, we signal back to the main thread that we are done doing work before terminating the thread. Remember, the original task system would normally longjmp back to the main task, where it would see the tasks status is completed and clean it up. We need to emulate this by signaling back to the main thread with the hWorkerSleepEvent to wake it up from the WaitForSingleObject call. Otherwise, the worker thread will terminate and the main thread will continue to wait for an event that will never be signaled.
|
1 2 3 4 5 6 7 8 9 10 11 12 13 14 15 |
// Cleanup the process (this does not free the stack allocation we store the thread info block in). huProc_CleanupTask(pTask); // Check if the task we are destroying is the current task. if (pTask == *g_huProcCurrentTask) { // Get the thread info block for the task. huTaskThreadInfo *pThreadInfo = (huTaskThreadInfo*)pTask->StackAllocation; // Signal the sleep event so huProc knows to schedule the next task. SetEvent(pThreadInfo->hWorkerSleepEvent); // Terminate the thread. ExitThread(0); } |
Next we need to change huProc_TaskWorker to use the event signals instead of longjmp’ing back to the task worker. For this we will first signal the task’s hWorkerRunEvent, and then wait indefinitely on the hWorkerSleepEvent which will be triggered when the task is done doing work.
|
1 2 3 4 5 6 7 8 9 10 11 12 13 14 |
// Get the thread info block for the task. huTaskThreadInfo *pThreadInfo = (huTaskThreadInfo*)pTask->StackAllocation; // Reset the sleep event. ResetEvent(pThreadInfo->hWorkerSleepEvent); // Signal the worker to wake up and do work. SetEvent(pThreadInfo->hWorkerRunEvent); // Sleep until the worker is done. WaitForSingleObject(pThreadInfo->hWorkerSleepEvent, INFINITE); // Set some flag value on the currently running task. (*g_huProcCurrentTask)->Flags |= 1; |
The last thing we need to do is prohibit the main thread from running huProc_SwitchTask. Since we don’t create a new thread and event handles for the main task we can’t possibly run this logic that uses the event handles. On top of that this is actually a dead lock scenario: If the main thread were to call huProc_SwitchTask it would sleep indefinitely until its hWorkerRunEvent is signaled. But this event would have to be signaled by the main thread, which is already sleeping, leaving us in a dead lock condition that we can never break free from. To fix this we just prohibit the main thread from running this function.
|
1 2 3 4 5 6 |
// Prohibit the main thread from running switch task. if (GetCurrentThreadId() == g_MainThreadId) { Hook_huProc_TaskWorker(1); return; } |
That finishes off the changes required for our huPROC redesign. Now the huPROC system will use real threads for each task, they all have their own real stack space with ample room for calling into the DirectX layer or any other API set with a large call graph.
Dead locking the UI thread
Running Frogger with our new huPROC redesign will stop the grame from crashing, however no window appears and nothing happens no matter how long you wait. So we have a problem, and since we just implemented a threading system dependent on event signaling, it could very well be that we introduced some sort of dead lock condition that previously was not possible. First thing to do is break in the debugger and check the callstacks to see if any of the threads look like they might be dead locked. There are two threads in particular that look like they could be related to the issue:
1:001> kn
# ChildEBP RetAddr
00 000cfd38 755d15ce ntdll!NtWaitForSingleObject+0x15
01 000cfda4 76e11194 KERNELBASE!WaitForSingleObjectEx+0x98
02 000cfdbc 76e11148 kernel32!WaitForSingleObjectExImplementation+0x75
03 000cfdd0 50df73ba kernel32!WaitForSingleObject+0x12
04 000cfee8 005383a7 Swampy!Hook_huProc_TaskWorker+0x19a [d:\visual studio 2015\swamplauncher\swampy\huproc.cpp @ 228]
05 000cfefc 0055f71c FrogADV+0x1383a7
06 000cff88 76e1336a FrogADV+0x15f71c
07 000cff94 775598f2 kernel32!BaseThreadInitThunk+0xe
08 000cffd4 775598c5 ntdll!__RtlUserThreadStart+0x70
09 000cffec 00000000 ntdll!_RtlUserThreadStart+0x1b
1:005> kn
# ChildEBP RetAddr
00 0481fd90 75f38326 user32!NtUserSetWindowLong+0x15
01 0481fdbc 75f471f5 user32!_SetWindowLong+0x143
02 0481fdd4 1008162d user32!SetWindowLongA+0x15
03 0481fdf4 10081881 dxwnd!GetThreadStartAddress+0x1ec7d
04 0481fe0c 0040fec6 dxwnd!GetThreadStartAddress+0x1eed1
05 0481fe68 00598dc8 FrogADV+0xfec6
06 0481fe78 0040fbc3 FrogADV+0x198dc8
07 0481fe8c 0041cfe5 FrogADV+0xfbc3
08 0481fea4 00412852 FrogADV+0x1cfe5
09 0481feb4 50df76ca FrogADV+0x12852
0a 0481ff88 76e1336a Swampy!huProc_ThreadWorker+0x5a [d:\visual studio 2015\swamplauncher\swampy\huproc.cpp @ 56]
0b 0481ff94 775598f2 kernel32!BaseThreadInitThunk+0xe
0c 0481ffd4 775598c5 ntdll!__RtlUserThreadStart+0x70
0d 0481ffec 00000000 ntdll!_RtlUserThreadStart+0x1b
Thread #1 which is the main game thread called our huProc_TaskWorker hook, where it then signaled a worker thread to run and called WaitForSingleObject to wait until the worker thread completed. The worker thread, thread #5, started in the huProc_ThreadWorker function we implemented, and eventually called NtUserSetWindowLong. The problem here is that we have stalled the main thread and executed a NtUser API that performs a callback to the main thread, which puts us into dead lock. The worker thread is waiting to message the main thread, which is currently waiting for the worker thread to finish. On the old huPROC system all tasks where executed on the game’s main thread, and the dead lock condition we are hitting was never possible.
We should be able to fix this by forcing the UI init task to run on the main thread. Normally the UI init function would execute as its own task, and at the end of the task would spin indefinitely while calling huProc_SwitchTask, allowing other tasks to run. We will change this to execute the UI init function on the main thread, and instead of spinning at the end we will just return. There are two changes that need to be made:
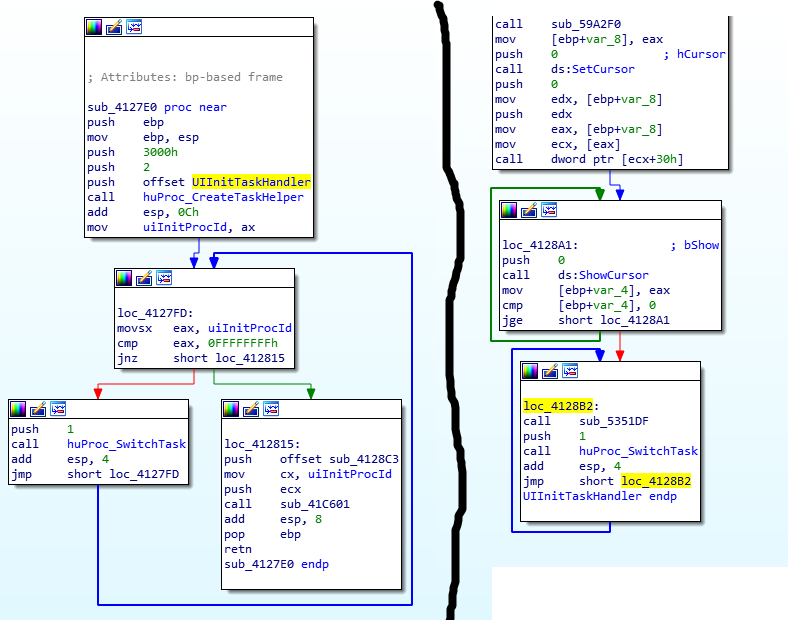
Patching sub_4127E0 to just jump to UIInitTaskHandler instead of creating a task for it will take care of running the UI init task on the main thread, and patching loc_4128B2 in UIInitTaskHandler to just return will take care of not spinning once the task is complete (sub_5351DF does not actually do anything and is not needed). With the changes made I crossed my fingers and ran the game again. If this doesn’t work as easily as I am hoping then we might be in for some serious modifications in order to make this work correctly.
Heck yeah! The game runs! There are two problems here however. The first is that although the game does run the intro videos render at a snails pace, it would take well over 15 minutes to get passed them and to the main menu. Once at the main menu things seem to run okay, though there are some issues with certain animations playing too fast or slow. Once you actually start the game it seems to play fine, but again there are some animations that do not play at the correct speed, and will actually prohibit you from passing parts of the first level. This is mostly where my adventure with this game ended, from here on out the work to fix the animations and intro videos was mostly Kneesnap. I’ll cover the fixes for these two issues but because I’m not entirely sure on all of the technical details the descriptions will not be as in-depth as the rest of this post.
Capping the frame rate
The problem with the animations is simple: rendering faster than 60fps causes the animations to play too fast. I’m not entirely sure how the game calculates the delta time for animations but there is most likely some error in the calculation. Either a floating point precision error or some assumption was made that no longer holds true on faster computers. The fix for this is to just cap the game to run no faster than 60FPS. Luckily there is code already in the game to do this. It exists as part of a compatibility mode that gets enabled depending what version of windows you are running, we just need to always enable it for Windows 7+.
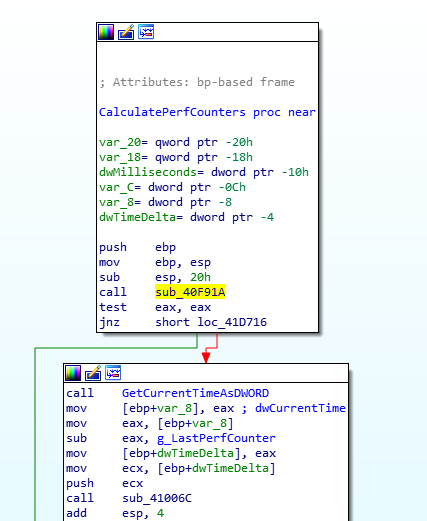
The sub_40F91A function gets a variable that tells the game if the compatibility code is not required, by patching this to force the game into the compatibility code path we can force it to run at 60FPS without affecting the other places this variable is used. This is done by changing the call instruction to a mov eax, 0, which forces us to always take the red path in the picture, enabling the 60FPS cap.
Dealying audio initialization
The problem with the intro videos playing at a snails pace comes from the directx audio layer. Figuring this out was a trial and error game of placing various break points in the game’s main loop and seeing what function was taking the most amount of time each frame. From there you traverse the call graph downwards until you pin point the culpret. Unfortunetely we did not find the exact function that causes this issue because the call graph became to large to keep traversing, but Kneesnap came up with another method for fixing this.
The solution was to delay the audio update function from running until after the intro videos ran. For whatever reason, this causes the intro videos to run at full speed, and allowing the audio update function to run there after has no discernible effects on the game. At one point I had run the game with a debug version of the direct audio dlls in hopes there might be some debug messages being spewed out that might clue us in on what was wrong. There are some debug messages that get printed and there is definitely something wrong with the way audio is being played, but the game seems to run fine as-is and I think at this point we were both tired of trying to solve issues that didn’t really affect game play.
There are 2 functions that need to be hooked in order to implement the audio fix. The first is the main menu update function which is called every frame when you are at the main menu, the second is the audio update function which is used to enqueue audio buffers for playback. The idea is that we setup a counter and increment it in the main menu update function, and prohibit the audio update function from running until the counter has reached a certain threshold. Once the threshold has been reached it is now safe to play audio normally.
|
1 2 3 4 5 6 7 8 9 10 11 12 13 14 15 16 17 18 19 |
void __cdecl Hook_MusicTick() { // If the sound state counter has reached the correct state update music. if (g_SoundState >= 2) { // Call the trampoline. MusicTick(); } } void __cdecl Hook_MainMenuUpdate(WORD procId) { // Check if we need to update the sound state. if (g_SoundState < 2) g_SoundState++; // Call the trampoline. MainMenuUpdate(procId); } |
Conclusion
That wraps up all the work we went through to get this game running on newer versions of Windows. There are still a few issues left but they don’t impact the game play and don’t really matter all that much in the end. It was fun working through the various issues and reimplementing the completely cursed task system, but I don’t think I will be doing this kind of thing again. I hope this post sheds some light on how dirty some of the systems behind video games can be, especially when hacks or assumptions for one platform end up getting ported to another.
For more information on Frogger modding, bug fixes, etc., you can checkout Kneesnap’s forum: https://highwayfrogs.net/
The source code and download for the game fix can be found on github: https://github.com/grimdoomer/FroggersAdventuresCompatFix