
Fixing Rendering Bugs in Dead Rising PC
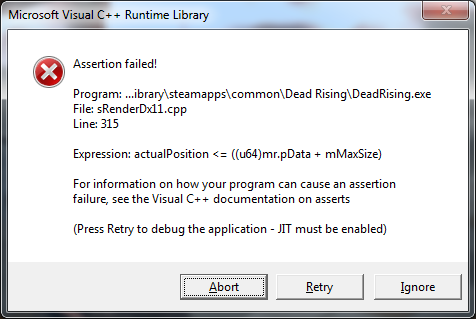
If you’ve played Dead Rising on PC you’ve probably encountered this error before. It’s a runtime assertion triggered by the DirectX rendering code for the game. It usually happens when the game tries to render too many explosions at once. It’s pretty easy to trigger by driving around the maintenance tunnels under the mall. Find an area that has enough gas tank wielding zombies, hit one, and if enough explosions are rendered at the same time you should get this error dialog and the game will close. In this post I’m going to go over how I root caused the underlying issues and fixed them in DeadRisingEx v1.5.7.45.
Initial investigation
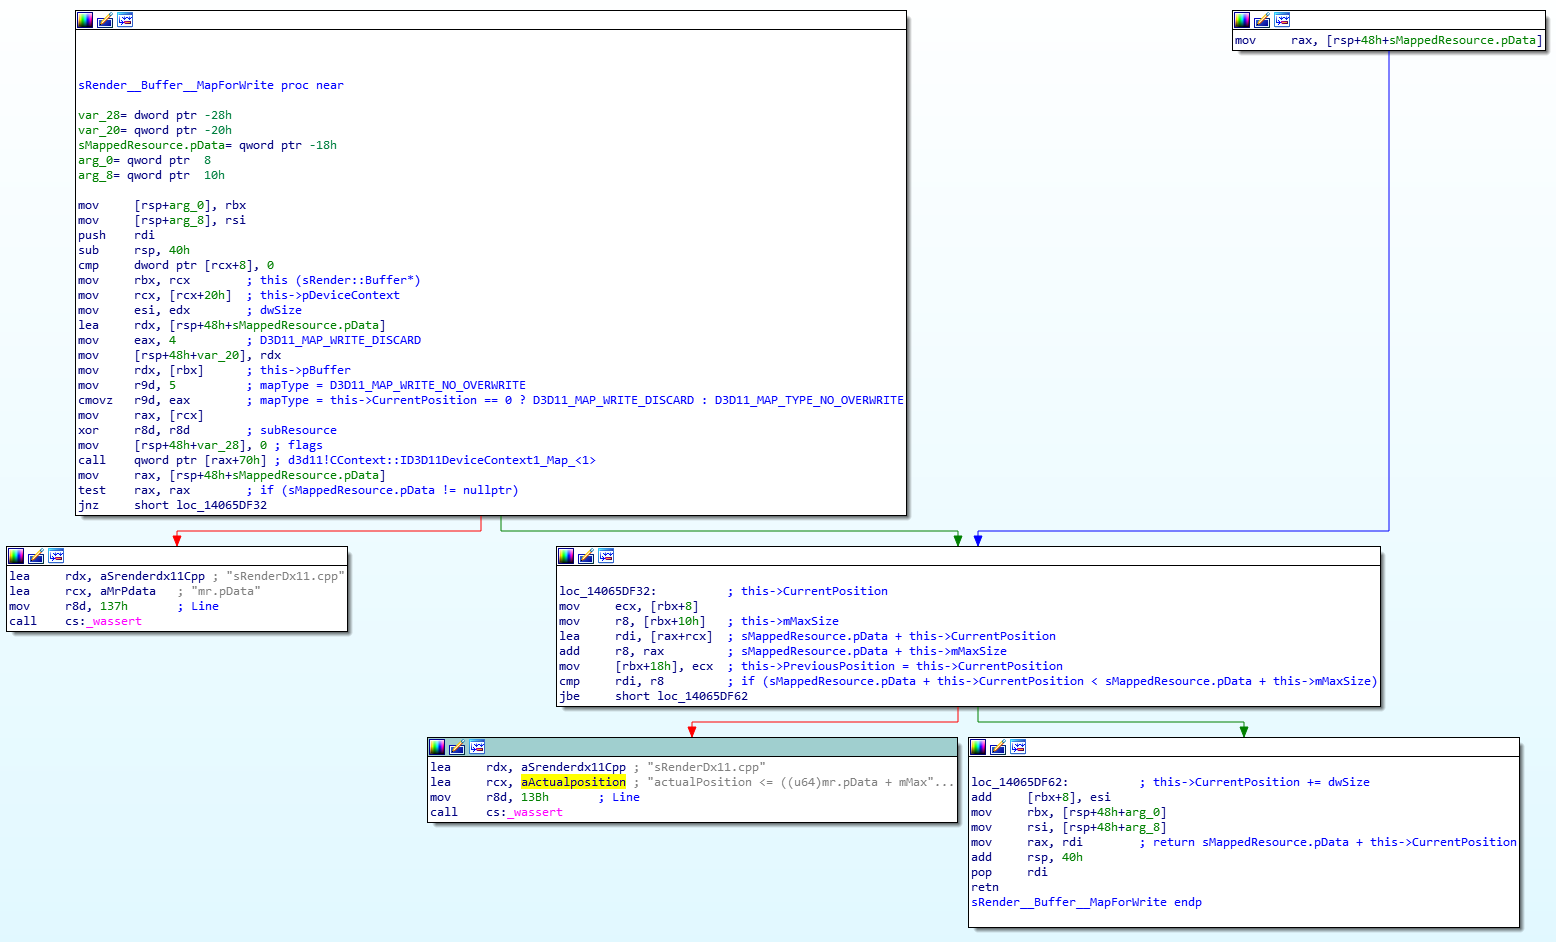
Searching for the text in the assert message in IDA brings us to the sRender::Buffer::MapForWrite function. The sRender class is the core of the rendering code for the game. It contains all the code to setup, render, and tear down the DirectX device and resources used by the rest of the game. The Buffer class wraps a DirectX GPU buffer and provides the game an easy way to map the buffer into memory to update its contents and bind it to the pipeline. The MapForWrite function is doing just that, mapping the GPU buffer for write access by the CPU so it can be updated. It’s called during the main rendering routine in the sRender class in order to write vertex and index data into the DirectX GPU buffers for rendering.
This translates into the following C++ code, the Buffer class definition has been included for additional context:
|
1 2 3 4 5 6 7 8 9 10 11 12 13 14 15 16 17 18 19 20 21 22 23 24 25 26 27 28 29 30 31 32 33 34 35 36 37 38 39 40 |
// sizeof = 0x30 class Buffer { #define BUFFER_TYPE_VERTEX 0 // Vertex buffer (D3D11_BIND_VERTEX_BUFFER) #define BUFFER_TYPE_INDEX 1 // Index buffer (D3D11_BIND_INDEX_BUFFER) /* 0x00 */ ID3D11Buffer *pBuffer; /* 0x08 */ DWORD CurrentPosition; // Current position in the buffer to write data to /* 0x10 */ ULONGLONG mMaxSize; // Total size of the buffer in bytes /* 0x18 */ DWORD PreviousPosition; /* 0x20 */ ID3D11DeviceContext *pDeviceContext; // Device context used to create the buffer /* 0x28 */ DWORD BufferType; // Type of buffer see BUFFER_TYPE_* above }; void * sRender::Buffer::MapForWrite(DWORD dwSize) { // Map the buffer for write access. D3D11_MAPPED_SUBRESOURCE mr = { 0 }; this->pDeviceContext->Map(this->pBuffer, 0, this->CurrentPosition == 0 ? D3D11_MAP_WRITE_DISCARD : D3D11_MAP_WRITE_NO_OVERWRITE, 0, &mr); if (mr.pData == nullptr) { // Failed to map the buffer for writing. _wassert(mr.pData, "sRenderDx11.cpp", 311); } // Update the previous position in the buffer and check if we have space for the data size requested. this->PreviousPosition = this->CurrentPosition; void *actualPosition = mr.pData + this->CurrentPosition; if (actualPosition >= mr.pData + this->mMaxSize) { // No more space left in the index buffer. _wassert(actualPosition >= mr.pData + this->mMaxSize, "sRenderDx11.cpp", 315); } // Update the current position in the buffer to account for the size requested. this->CurrentPosition += dwSize; // Return a pointer to the data for writing. return actualPosition; } |
The issue occurs on lines 29 and 32. When the CurrentPosition of the buffer exceeds mMaxSize the assert is triggered and the game crashes. Something interesting to note is that the assert is only triggered after the size of the buffer has already been exceeded, meaning that memory corruption has already occurred past the end of the buffer by the time the assert is triggered. This issue is easy enough to fix and we have a couple options on what we can do here:
- Discard any rendering commands that would add data past the end of the vertex/index buffers
- Cons: This will cause objects to not be rendered for a few frames and most likely create a flickering effect until the number of objects being rendered decreases
- Increase the size of the vertex and index buffers when they are created during game init
- Pros: Won’t cause a flickering effect while rendering, doesn’t drop frames
- Cons: We still don’t know how much stuff is going to be rendered during game play. We could increase the size of the buffers substantially, but VRAM size varies from GPU to GPU and there is the possibility someone is playing this on a potato of a PC that doesn’t have enough VRAM. This also doesn’t stop the issue from reoccurring
- Dynamically increase the size of the vertex/index buffers as needed
- Pros: Allows us to continuously “recover” from out of memory issues until no more VRAM is available on the GPU
- Cons: We will need to copy the contents of the old vertex/index buffer into the new one, and mapping a GPU buffer for CPU read access is extremely expensive. Since this will be happening in the main rendering loop this will cause the game to lag for a few frames while the data is transferred from GPU to CPU during the read operation. However, this only occurs when we need to resize the buffer, which should be pretty rare
I chose to go with option 2 and 3, and the reason is that this has, in my opinion, the minimal impact on the player experience. Option 1 will cause objects to disappear for a few frames and create a flickering effect which seems pretty gross. Option 2 could impact people playing on potato PC’s, and while it’s pretty unlikely to happen, the game does have very low spec requirements, needing only 2GB of RAM and 1GB of VRAM to play, and I didn’t have any data on how many people might be playing the game on a potato PC. However, once I found out how much VRAM is actually reserved for the vertex/index buffers in question, increasing their initial size became a much more viable option. Option 3 isn’t perfect as it will cause lag for a few frames while data is transferred from the GPU to CPU, but this will only happen when we need to resize the vertex/index buffers which should be a rare occurrence.
Resizing GPU buffers
First thing is to see how large the vertex and index buffers are when they are created. I found that they are created in the constructor for the sRender class. There are 2 vertex buffers that allocate 4MB each, and 2 index buffers that allocate 0.25MB each. The reason there are 2 vertex and index buffers is because the game uses deferred rendering. While the data for Frame N is being processed by the CPU, the GPU is rendering data for frame N-1. Every frame the buffers being used by the CPU are switched out so the GPU can render the contents of the now previous frame. So what do these vertex and index buffers contain if they are so small? Mostly HUD elements and particle effects like smoke, fire, and blood. This makes sense as the thing that usually triggers this bug is too many explosions at one time, which would create a lot of smoke, fire, and blood effects. This is why I choose to go with option 2 as well, because the buffers in question are so small that it makes sense to increase their initial size, which will ultimately reduce the number of times we will need to re-allocate the vertex and index buffers.
The DirectX buffers are allocated in the constructor for the sRender::Buffer class, changing this was as easy as hooking this constructor and changing the size used to allocate the buffers. I choose to increase each vertex buffer from 4MB to 15MB, and each index buffer from 0.25MB to 5MB. This changes the overall memory requirements for these buffers from 8.5MB to 40MB. There is a reason behind why I chose those numbers but I will get to that in a bit.
|
1 2 3 4 5 6 7 8 9 10 11 12 13 14 15 16 17 18 19 20 21 22 23 24 25 26 27 28 29 30 31 32 33 34 35 36 37 38 39 40 41 42 43 44 45 |
sRender::Buffer * __stdcall Hook_sRender__Buffer_ctor(sRender::Buffer *thisptr, ID3D11DeviceContext *pDeviceContext, DWORD dwBufferSize, DWORD dwBufferType) { // Check the buffer type and increase the size to avoid crashes. if (dwBufferType == BUFFER_TYPE_VERTEX) dwBufferSize = 15 * 1024 * 1024; // 15MB for vertex buffers else dwBufferSize = 5 * 1024 * 1024; // 5MB for index buffers // Initialize fields. thisptr->pBuffer = nullptr; thisptr->pDeviceContext = pDeviceContext; thisptr->BufferType = dwBufferType; thisptr->CurrentPosition = 0; thisptr->PreviousPosition = 0; thisptr->mMaxSize = dwBufferSize; // Make sure the device context is valid. if (pDeviceContext == nullptr) { // Fatal error: device context is null. ImGuiConsole::Instance()->ConsolePrint(L"FATAL: sRender::Buffer::Buffer() was passed a null d3d device context!\n"); assert(pDeviceContext); } // Setup the buffer descriptor. D3D11_BUFFER_DESC bufferDesc = { 0 }; bufferDesc.Usage = D3D11_USAGE_DYNAMIC; bufferDesc.ByteWidth = dwBufferSize; bufferDesc.CPUAccessFlags = D3D11_CPU_ACCESS_WRITE; bufferDesc.BindFlags = thisptr->BufferType == BUFFER_TYPE_VERTEX ? D3D11_BIND_VERTEX_BUFFER : D3D11_BIND_INDEX_BUFFER; // Get the d3d device pointer from sRender instance. ID3D11Device *pD3dDevice = *(ID3D11Device**)(((BYTE*)sRender::Instance()) + 0x8590); // Create the buffer. HRESULT hr = pD3dDevice->CreateBuffer(&bufferDesc, nullptr, &thisptr->pBuffer); if (hr != S_OK) { // Failed to create buffer. ImGuiConsole::Instance()->ConsolePrint(L"FATAL: sRender::Buffer::Buffer() failed to create ID3D11Buffer hr=0x%08x!\n", hr); assert(hr == S_OK); } return thisptr; } |
Next we need to change the behavior of sRender::Buffer::MapForWrite to do the following:
- Check if the requested buffer size exceeds the maximum size of the vertex/index buffer
- If so allocate a new vertex/index buffer that is large enough to hold the requested data plus some additional space
- Copy all data in the current vertex/index buffer into the new one
|
1 2 3 4 5 6 7 8 9 10 11 12 13 14 15 16 17 18 19 20 21 22 23 24 25 26 27 28 29 30 31 32 33 34 35 36 37 38 39 40 41 42 43 44 45 46 47 48 49 50 51 52 53 54 55 56 57 58 59 60 61 62 63 64 65 66 67 68 69 70 71 72 73 |
void * __stdcall Hook_sRender__Buffer__MapForWrite(sRender::Buffer *thisptr, DWORD dwSize) { // Check if the size requested will exceed the capacity of the buffer. if (thisptr->CurrentPosition + dwSize <= thisptr->mMaxSize) { // Requested size is okay, call the trampoline. return sRender::Buffer::_MapForWrite(thisptr, dwSize); } // Calculate the new buffer size needed and round up to the nearest megabyte. DWORD newBufferSize = ((thisptr->CurrentPosition + dwSize) + 0x100000) & ~(0x100000 - 1); ImGuiConsole::Instance()->ConsolePrint(L"WARNING: sRender::Buffer out of memory, resizing [%s] buffer %.2FMB -> %.2fMB\n", (thisptr->BufferType == BUFFER_TYPE_VERTEX ? L"Vertex" : L"Index"), (float)thisptr->mMaxSize / (float)(1024 * 1024), (float)newBufferSize / (float)(1024 * 1024)); // Setup the buffer descriptor for the new buffer. D3D11_BUFFER_DESC bufferDesc = { 0 }; bufferDesc.Usage = D3D11_USAGE_DYNAMIC; bufferDesc.ByteWidth = newBufferSize; bufferDesc.CPUAccessFlags = D3D11_CPU_ACCESS_WRITE; bufferDesc.BindFlags = thisptr->BufferType == BUFFER_TYPE_VERTEX ? D3D11_BIND_VERTEX_BUFFER : D3D11_BIND_INDEX_BUFFER; // Get the d3d device pointer from sRender instance. ID3D11Device *pD3dDevice = *(ID3D11Device**)(((BYTE*)sRender::Instance()) + 0x8590); // Create the buffer. ID3D11Buffer *pNewBuffer = nullptr; HRESULT hr = pD3dDevice->CreateBuffer(&bufferDesc, nullptr, &pNewBuffer); if (hr != S_OK) { // Failed to create buffer. ImGuiConsole::Instance()->ConsolePrint(L"FATAL: sRender::Buffer::MapForWrite() failed to create new ID3D11Buffer hr=0x%08x!\n", hr); assert(hr == S_OK); } // Setup the copy box for copying the contents of the old buffer. D3D11_BOX srcBox = { 0 }; srcBox.left = 0; srcBox.right = thisptr->CurrentPosition; srcBox.top = 0; srcBox.bottom = 1; srcBox.front = 0; srcBox.back = 1; // Copy the contents of the old buffer into the new one. thisptr->pDeviceContext->CopySubresourceRegion(pNewBuffer, 0, 0, 0, 0, thisptr->pBuffer, 0, &srcBox); // TODO: CopySubresourceRegion works asynchronously since the GPU is the one doing the copy. Because of that we // can't immediate destroy the old buffer (I think). So we will need to implement a deferred destruction of it // in a subsequent frame. For now we just eat it. ID3D11Buffer *pOldBuffer = thisptr->pBuffer; // Update the buffer properties. thisptr->mMaxSize = newBufferSize; thisptr->pBuffer = pNewBuffer; // Map the buffer for write access. D3D11_MAPPED_SUBRESOURCE mappedResource = { 0 }; hr = thisptr->pDeviceContext->Map(thisptr->pBuffer, 0, thisptr->CurrentPosition == 0 ? D3D11_MAP_WRITE_DISCARD : D3D11_MAP_WRITE_NO_OVERWRITE, 0, &mappedResource); if (hr != S_OK || mappedResource.pData == nullptr) { // Failed to map the buffer for writing. ImGuiConsole::Instance()->ConsolePrint(L"FATAL: sRender::Buffer::MapForWrite() failed to map buffer for writing!\n"); assert(mappedResource.pData); } // Update the current and previous positions. thisptr->PreviousPosition = thisptr->CurrentPosition; thisptr->CurrentPosition += dwSize; // Return a pointer to the data for writing. return (BYTE*)mappedResource.pData + thisptr->CurrentPosition; } |
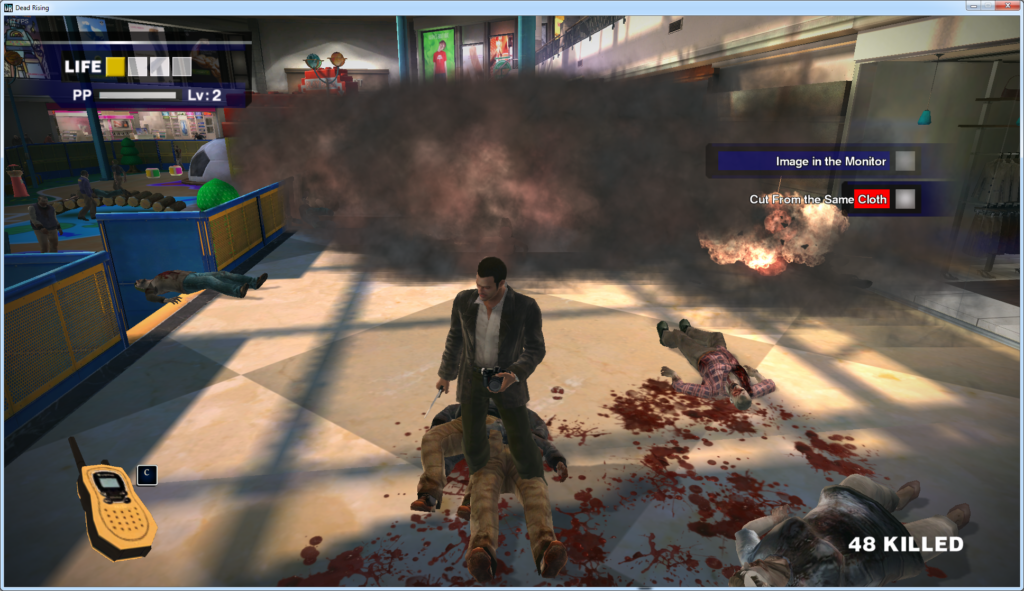
To trigger this bug and test my fixes I have been using my “Cursed Grenade” mod. It’s a mod I made that causes grenades to spawn more grenades on detonation, recursively, for up to 4 iterations. This is a very easy to way to create a ton of explosions and trigger the bug. This is also what I was using to benchmark what I thought would be a good initial size for the vertex and index buffers. When I could set off the cursed grenade and not have the vertex and index buffers get re-allocated, that is what I used as the initial size. This ended up being 15MB for vertex buffers and 5MB for index buffers.
After testing the fixes I implemented above the vertex and index buffers were successfully being re-allocated when they reach capacity. So that issue is fixed, however, there is another crash in a new location. In my experience with fixing bugs in Dead Rising there is always another bug.
Time travel debugging to the rescue
Based on the crashes I was getting the next bug appeared to be memory corruption. This game is actually filled with memory corruption bugs. To date I have fixed 15 and counting, but they are so numerous that I have only made small progress on the overall number of bugs that exist. I tried a few different techniques to see if I could pinpoint where the memory corruption was occurring, but I wasn’t having any luck. A friend of mine had been trying to get me to try out time travel debugging (TTD) and I figured this was a good chance to try it out and see how it goes. If you’re not familiar with TTD it works by taking a recording of a running process. This recording contains every event that occurred in the process up until it exits, crashes, or you stop the recording. You can then play back the recording in a debugger and step through everything that happened instruction by instruction, and even run execution backwards to “rewind” the program. It’s extremely useful for memory corruption bugs since I can just “rewind” and see where the memory in question was modified.
To help with the investigation I wrote a quick WinDbg and IDA plugin that would let me run stack traces in WinDbg using the function names in my IDA db. This would let me quickly see if the functions in the stack trace were ones I had already reverse engineered. Once I had the TTD trace recorded I took a look at the exception thrown and faulting stack trace:
(1d30.af0): Break instruction exception – code 80000003 (first/second chance not available)
00007ff82bc94007 8a01 mov al, byte ptr [rcx] ds:3f00000000000000=??
0:008> .load C:_share\simplext.dll
0:008> !idasync DeadRising
Connected to ida server for module DeadRising
0:008> !stack
# Child-SP RetAddr Call Site
00 000000d4e1afda80 00007ff82bc94250 d3d11!StringHasTrailingDigitAndLowerCaseCharSum+0x27
01 000000d4e1afdc70 00007ff82bc90ff0 d3d11!CCreateInputLayoutValidator::ValidateInputElements+0x1e8
02 000000d4e1afdcb0 00007ff82bc90e3e d3d11!CCreateInputLayoutValidator::Validate+0x74
03 000000d4e1afdef0 00007ff82bc90ce6 d3d11!CDevice::CreateInputLayout_Worker+0xde
04 000000d4e1afdf40 00007ff70617d8df d3d11!CDevice::CreateInputLayout+0x26
05 000000d4e1afe1e0 00007ff7061864fb sRender::FindOrAddInputLayout+0x16f
06 000000d4e1afe590 00007ff706182771 sRender::SetInputLayoutAndVertexBuffers+0x27b
07 000000d4e1affae0 00007ff70618428b sRender::DrawFrame+0x571
08 000000d4e1affb10 00007ff8316e7bd4 sRender::RenderLoopProc+0x4b
09 000000d4e1affb40 00007ff831f2ced1 KERNEL32!BaseThreadInitThunk+0x14
0a 000000d4e1affbc0 0000000000000000 ntdll!RtlUserThreadStart+0x21
From the output we can see there was an access violation (exception 0x80000003) in some d3d11 function related to creating an input layout while trying to access the address 0x3f00000000000000. An input layout is vertex declaration, basically a descriptor that tells the gpu what type of vertex elements it can find in a vertex buffer, what offset they are at, their format, and some other information. The input parameters for CreateInputLayout are very simple, and based on the call stack the issue is most likely with the semantic names in the pInputElementDescs parameter. Investigating the parameters after the function executes in an optimized binary is normally very difficult, however, with TTD we can just place a breakpoint on the call to CreateInputLayout and rewind the trace to see what the parameters were. After doing so I found there were 16 elements in the input layout array and dumping the semantic names gave me the following (rdx is the input layout array address and r8 is the number of elements in the array):
0:008> .for (r $t0=0; @$t0 < @r8; r $t0=@$t0+1) { ?? *(char **)(@rdx + (@$t0 * 32)) }
char * 0x00007ff706784110
“POSITION”
char * 0x00007ff706784110
“POSITION”
char * 0x00007ff706784110
“POSITION”
char * 0x00007ff706784110
“POSITION”
char * 0x00007ff706784110
“POSITION”
char * 0x00007ff706784110
“POSITION”
char * 0x00007ff706784110
“POSITION”
char * 0x00007ff706784178
“TESSFACTOR”
char * 0x00007ff706784150
“TEXCOORD”
char * 0x00007ff706784194
“COLOR”
char * 0x00007ff706784140
“NORMAL”
char * 0x3f00000000000000
“— memory read error at address 0x3f00000000000000 —“
char * 0x00007ff7067841a0
“DEPTH”
char * 0x00007ff706784150
“TEXCOORD”
char * 0x00007ff706784194
“COLOR”
char * 0x00007ff706784140
“NORMAL”
Looking at the output we can see there are a suspicious number of POSITION elements but we also see one of the string addresses is 0x3f00000000000000 which is the address that caused the crash. Now that we confirmed the inputs going into d3d11!CDevice::CreateInputLayout are bad, lets take a look at sRender::FindOrAddInputLayout which is responsible for building the input layout array entries:
|
1 2 3 4 5 6 7 8 9 10 11 12 13 14 15 16 17 18 19 20 21 22 23 24 25 26 27 28 29 30 31 32 33 34 35 36 37 38 39 40 41 42 43 44 45 46 47 48 49 50 51 52 53 54 55 56 57 58 59 60 61 62 63 64 65 66 67 68 69 70 71 72 73 74 75 76 77 78 |
// sizeof = 0x8 struct cTrans::VertexDeclElement { /* 0x00 */ WORD Slot; /* 0x02 */ WORD Offset; /* 0x04 */ WORD Format; /* 0x06 */ BYTE SemanticNameIndex; /* 0x07 */ BYTE SemanticIndex; }; // sizeof = 0x40 struct rShaderVertexShaderDesc { /* 0x00 */ DWORD ByteCodeSize; /* 0x04 */ // padding /* 0x08 */ void *pShaderByteCode; // Shader byte code address in memory /* 0x10 */ void *pShaderByteCodeOffset; // offset into shader byte code buffer, gets set to something else during init /* 0x18 */ WORD SemanticIndices[16]; // Indices into g_VertexDeclarationSemanticNames used to create input layouts /* 0x38 */ ULONGLONG Flags; // Upper 14 bits are count for array /* 0x40 */ rShaderParameterReference Parameters[]; }; const char * g_VertexDeclarationSemanticNames[] = { "POSITION", "BLENDWEIGHT", "BLENDINDICES", "NORMAL", "PSIZE", "TEXCOORD", "TANGENT", "BINORMAL", "TESSFACTOR", "POSITIONT", "COLOR", "FOG", "DEPTH", "SAMPLE" }; ID3D11InputLayout* sRender::FindOrAddInputLayout(cTrans::VertexDeclElement *pVertexDeclElements, DWORD dwVertexDeclElements, rShaderVertexShaderDesc *pVertexShaderDesc) { // Calculate the CRC for the input layout using the vertex declaration elements provided. DWORD inputLayoutId = 0xFFFFFFFF; if (dwVertexDeclElements * sizeof(cTrans::VertexDeclElement) > 0) { inputLayoutId = CRC32(pVertexDeclElements, dwVertexDeclElements * sizeof(cTrans::VertexDeclElement)); } // Check if we have an input layout for this vertex declaration. if (this->mInputLayouts.find(inputLayoutId) != this->mInputLayouts.end()) return this->mInputLayouts[inputLayoutId]; // Loop and setup the input element descriptors. D3D11_INPUT_ELEMENT_DESC InputElementDesc[16] = { 0 }; for (int i = 0; i < dwVertexDeclElements; i++) { InputElementDesc[i].SemanticName = g_VertexDeclarationSemanticNames[pVertexDeclElements[i].SemanticNameIndex]; InputElementDesc[i].SemanticIndex = pVertexDeclElements[i].SemanticNameIndex; InputElementDesc[i].InputSlotClass = D3D11_INPUT_PER_VERTEX_DATA; InputElementDesc[i].InputSlot = pVertexDeclElements[i].Slot; InputElementDesc[i].AlignedByteOffset = pVertexDeclElements[i].Offset; if (pVertexDeclElements[i].Format != DXGI_FORMAT_R8G8B8A8_UNORM) InputElementDesc[i].Format = pVertexDeclElements[i].Format; else InputElementDesc[i].Format = DXGI_FORMAT_R8G8B8A8_UNORM; } // Create the input layout. ID3D11InputLayout *pInputLayout = nullptr; this->pD3dDevice->CreateInputLayout(&InputElementDesc, dwVertexDeclElements, pVertexShaderDesc->pByteCode, pVertexShaderDesc->ByteCodeSize, &pInputLayout); // Add the input layout to the map of created layouts and return the layout pointer. this->mInputLayouts[inputLayoutId] = pInputLayout; return pInputLayout; } |
FindOrAddInputLayout is a pretty simple function, it takes an array of cTrans::VertexDeclElement structs that describe elements in the vertex stream and creates a directx input layout that can be used in the rendering pipeline. The issue comes from line 58, where we index into g_VertexDeclarationSemanticNames using the index specified by pVertexDeclElements[i].SemanticNameIndex. So the vertex declaration elements provided to FindOrAddInputLayout are bad which causes the parameters passed to d3d11!CDevice::CreateInputLayout to be bad as well. Rewinding execution I can see index that was being used for the bad address was 0xA8, which is way past the end the the array (14 elements in total). Interestingly enough every single entry in the array had an out of bounds index, it just so happened to point to some data that referenced the same strings used in the g_VertexDeclarationSemanticNames array. It’s safe to say this entire block of data being used to build the input layout is corrupt. Lets jump up one more call in the stack to see how sRender::SetInputLayoutAndVertexBuffers provides the cTrans::VertexDeclElement array.
SetInputLayoutAndVertexBuffers works similarly to FindOrAddInputLayout, it gets passed some shader and vertex info and builds an array of cTrans::VertexDeclElement structs to pass to FindOrAddInputLayout. All this function is really doing is reorganizing information it was given. Since the function itself isn’t very important and we only care about the data that it’s using I’m only going to cover it briefly.
The explanation of this function is going to get a little directx heavy, so if you are not familiar with the basics of vertex declarations here is a brief summary. As I mentioned earlier a vertex declaration is a descriptor that describes each element in a vertex stream. There are many different types of elements such has vertex positions, texcoords (UV), normals, color, depth, vertex weights, etc. Each element type has a name or a semantic: POSITION, TEXCOORD, COLOR, NORMAL, etc. Certain elements can be used more than once, for example a model may have multiple textures applied to it which have separate UV coordinates for each texture. The vertex declaration will have multiple TEXCOORD elements each with a semantic index that is used to distinguish them from each other, the resulting semantic name will look like TEXCOORD0, TEXCOORD1, TEXCOORD2, etc. Each element also has a format which is an enum value describing the binary format of the element. For position you might just have 3 floats for the x, y, and z components of the vertex position, or you can pack the vector into a number of different formats to save space in VRAM. This format value tells the GPU how to read the element from the vertex stream when it goes to process it. There are a few more fields in each vertex declaration element but these are the ones relevant to the bug at hand. If any of these values are bad it can cause a number of issues like incorrectly rendered models, or in this case crashing the game outright. Now that we have a base understanding of how vertex declarations work lets take a look at the implementation of SetInputLayoutAndVertexBuffers with the irrelevant parts removed:
|
1 2 3 4 5 6 7 8 9 10 11 12 13 14 15 16 17 18 19 20 21 22 23 24 25 26 27 28 29 30 31 32 33 34 35 36 37 38 39 40 41 42 43 44 45 46 47 48 49 50 51 52 53 54 55 56 57 58 59 60 61 62 63 64 65 66 67 68 69 70 71 72 73 74 75 76 77 78 79 80 81 82 83 84 85 86 |
// sizeof = 0x8 struct cTrans::VertexDeclElement { /* 0x00 */ WORD Slot; /* 0x02 */ WORD Offset; /* 0x04 */ WORD Format; /* 0x06 */ BYTE SemanticNameIndex; /* 0x07 */ BYTE SemanticIndex; }; // sizeof = 0x30 struct VertexDecl : public Element { /* 0x18 */ void *Unk1; /* 0x20 */ VertexDeclElement *pElements; // Element array, last element slot = 0xFF /* 0x28 */ DWORD mElementNum; // Number of elements in the array /* 0x2C */ DWORD Id; // Checksum? (0x140688ED0) }; // sizeof = 0x40 struct rShaderVertexShaderDesc { /* 0x00 */ DWORD ByteCodeSize; /* 0x04 */ // padding /* 0x08 */ void *pShaderByteCode; // Shader byte code address in memory /* 0x10 */ void *pShaderByteCodeOffset; // offset into shader byte code buffer, gets set to something else during init /* 0x18 */ WORD SemanticIndices[16]; // Indices into g_VertexDeclarationSemanticNames used to create input layouts /* 0x38 */ ULONGLONG Flags; // Upper 14 bits are count for array /* 0x40 */ rShaderParameterReference Parameters[]; }; void sRender::SetInputLayoutAndVertexBuffers(cTrans::VertexDecl *pVertexDecl, void *pUnk, rShaderVertexShaderDesc *pVertexShaderDesc) { cTrans::VertexDeclElement vertexDeclaration[16] = { 0 }; DWORD elementsAdded = 0; DWORD elementsExisting = 0; DWORD elementIndex = pVertexDecl->mElementNum; ... // Loop through all the possible vertex elements. for (int i = 0; i < 16; i++) { // Check for the end marker. BYTE semanticNameIndex = (BYTE)(pVertexShaderDesc->SemanticIndices[i] >> 8); BYTE semanticIndex = (BYTE)pVertexShaderDesc->SemanticIndices[i]; if (semanticNameIndex == 0xFF) break; // If there are no vertex elements to be added skip searching for an existing one. if (pVertexDecl->mElementNum == 0) goto AddElement; // Check if the vertex declaration already has an element with matching semantic name and index. for (int x = 0; x < pVertexDecl->mElementNum; x++) { if (pVertexDecl->pElements[x].SemanticNameIndex == semanticNameIndex && pVertexDecl->pElements[x].SemanticIndex == semanticIndex) { // Copy the existing item. vertexDeclaration[elementsExisting] = pVertexDecl->pElements[x]; elementsExisting++; goto NextElement; } } AddElement: // An existing element was not found, add a new one. vertexDeclaration[elementIndex].SemanticNameIndex = semanticNameIndex; vertexDeclaration[elementIndex].SemanticIndex = semanticIndex; vertexDeclaration[elementIndex].Offset = 0; vertexDeclaration[elementIndex].Format = (BYTE)g_VertexDeclarationSemanticFormats[pSemanticIndices[i].SemanticNameIndex]; elementIndex++; elementsAdded++; NextElement: } ... // Create and cache the input layout for faster lookup later. ID3D11InputLayout *pInputLayout = FindOrAddInputLayout(&vertexDeclaration, elementsAdded + elementsExisting, pVertexShaderDesc); ... } |
The logic in the function above may seem a little confusing but it is actually quite simple. The function is passed a cTrans::VertexDecl which is a structure containing existing vertex declaration elements for the shader, and a rShaderVertexShaderDesc descriptor which has some information on the actual shader binary code: a pointer to the code buffer, a list of parameters the vertex shader takes, and a list of indices for the semantic names and format of each element in the vertex stream. This is where the bad index that was used in FindOrAddInputLayout comes from (see line 70). In the loop above we build the cTrans::VertexDeclElement array that gets passed to FindOrAddInputLayout. For every semantic index in the rShaderVertexShaderDesc descriptor we first check if the cTrans::VertexDecl has a vertex declaration element that matches, if one is found we copy it to the array that’s passed to FindOrAddInputLayout, if an existing entry is not found we add a new one. Once all elements in the vertex stream have been processed we call FindOrAddInputLayout.
Stepping through the debugger I saw that the SemanticIndex field of the cTrans::VertexDeclElement’s are coming directly from the SemanticIndices field in the rShaderVertexShaderDesc descriptor. This data actually comes directly from the game files on disk which are read during initialization. The files are 100% valid so something has overwritten this data in memory. This causes the vertex declaration elements to contain trash data and ends up crashing the game when trying to create the input layout. To find out where this data is being overwritten I placed a data breakpoint on the address of the SemanticIndices field and ran execution backwards until I got a hit. Looking at the call stack for the write to the SemanticIndices field shows that we ended up in a function I called cTrans::SortRenderCommands:
Breakpoint 7 hit
Time Travel Position: 34E2704:20AD
DeadRising+0x68cde7:
00007ff7061acde7 488943f8 mov qword ptr [rbx-8], rax
0:003> !stack
# Child-SP RetAddr Call Site
00 000000d4e11ff6c0 00007ff7061aa8c8 cTrans::SortRenderCommands+0x35b
01 000000d4e11ff6f0 00007ff706164df0 cTrans::SortRenderCommands_0+0x28
02 000000d4e11ff720 00007ff705bccf44 sMain::WorkerThreadInfo::ProcessWorkItems+0x210
03 000000d4e11ff7e0 00007ff706164b94 sSnatcherMain::ThreadWorkerProc+0x84
04 000000d4e11ff810 00007ff7062c5a5f sMain::WorkerThreadProc+0x14
05 000000d4e11ff840 00007ff8316e7bd4 sub_1407A5A30+0x2f
06 000000d4e11ff870 00007ff831f2ced1 KERNEL32!BaseThreadInitThunk+0x14
07 000000d4e11ff8f0 0000000000000000 ntdll!RtlUserThreadStart+0x21
Before I get into what the cTrans::SortRenderCommands function does lets take a look at what a single frame in Dead Rising looks like at a high level in order to understand exactly where we are in the render loop.
A single frame in Dead Rising
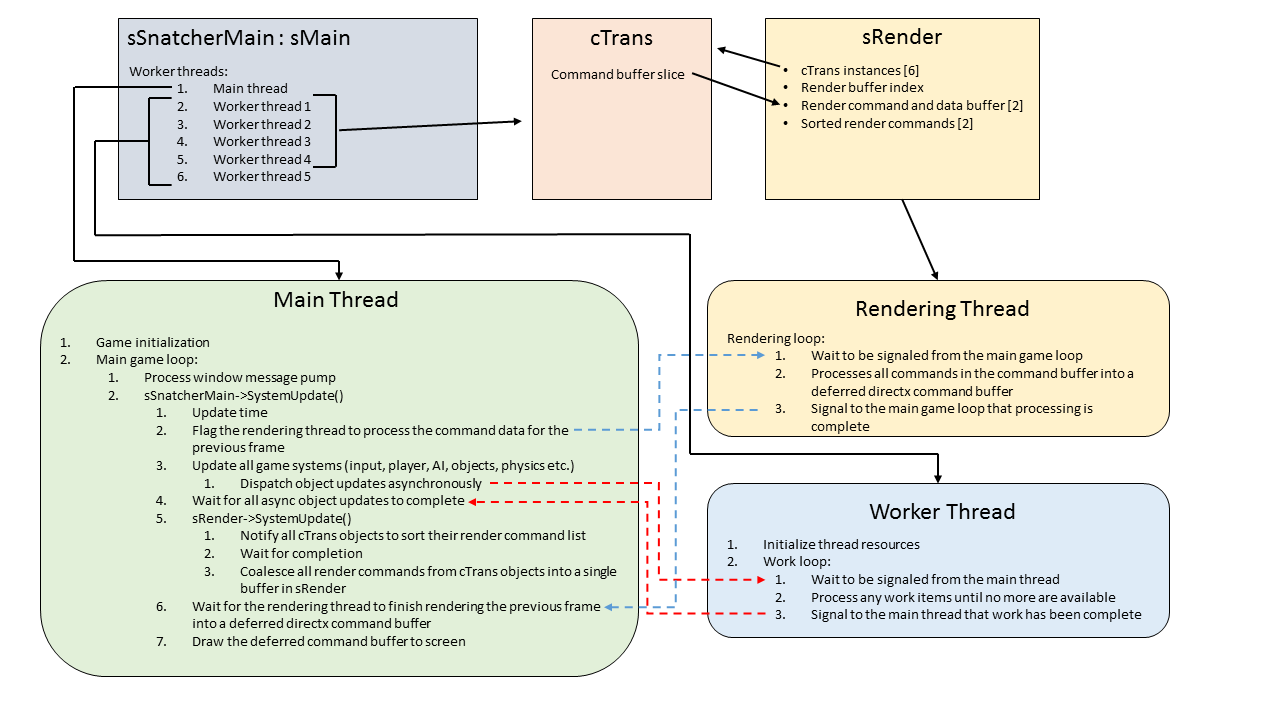
This diagram might seem a little hectic but it is fairly simple once we break it down. Starting with sSnatcherMain this is the main class for the game, it’s responsible for initializing all the game subsystems (graphics, sound, input, worker threads, etc.), and contains the main game loop. sSnatcherMain has 6 threads it tracks, the first being the main thread for the game, 4 worker threads with rendering capabilities, and 1 worker thread with no rendering capabilities. Each worker thread runs the logic seen in the “Worker Thread” box: initializing resources for itself, and sitting in a loop where it waits for work to be dispatched, processes the work items, and then signals that the work has been completed. These worker threads handle a number of tasks such as loading game files, updating game objects, queuing rendering commands, and loading new levels.
Next is the sRender class, this is the graphics subsystem for the game, it’s responsible for setting up all DirectX resources (swap chains, depth buffer, render targets, device contexts, etc.), processing all directx rendering commands, and presenting the final image to screen. It has its own thread seen in the “Rendering Thread” box, which is responsible for asynchronously rendering a single frame to a deferred directx command buffer. Dead Rising uses a deferred rendering system: while the main thread is updating game logic for frame N, the rendering thread is processing commands for frame N-1, this helps make sure the time the CPU is waiting for the GPU to draw things to the screen is minimal. sRender has 2 deferred device contexts, 2 command buffers for every cTrans object, and 2 sorted command buffers that are used by the rendering thread for processing. Each frame the index for which of these objects to use is flipped between 0 and 1, while the rendering thread is processing the data from command buffer [0], the worker threads are putting new commands into command buffer [1], once the rendering thread is done processing command buffer [0], the index is switched and the process repeats with the opposite buffers.
Finally cTrans is like a mini version of sRender but used by a single worker thread that has rendering capabilities. It’s used to queue deferred rendering commands into a command list that can be processed by the rendering thread. There are 6 cTrans objects owned by sRender, one for each tracked thread in sSnatcherMain, but only threads 1-4 have rendering capabilities. The main thread owns the directx device context so it doesn’t need a cTrans object. Each frame the 4 cTrans objects are given a section of the active render command buffer owned by sRender. cTrans uses this buffer to store rendering commands and data that are created while processing game object updates dispatched from the main game loop. Every object that needs to be drawn on screen (level geometry, items, the player, enemies, HUD elements, etc.) will put rendering commands into the cTrans command buffer owned by the worker thread. The commands are game defined and tell the rendering thread what directx calls to make: update a vertex buffer, draw primitives, clear the back buffer, etc. Rendering a single game object might add one command to the cTrans buffer which gets turned into multiple directx calls to actually draw the object on screen. If this seems confusing just note that “command buffer” means game defined commands the rendering thread can process, and “directx command buffer” means directx calls the GPU can process.
After all game object updates complete and all commands are in the command buffers the worker threads signal back to the main game thread that their work is complete, and a new work item is queued to coalesce all the commands from the 4 cTrans objects into a single sorted command buffer owned by sRender. Every command that is added to one of the cTrans command buffers has a tag number associated with it that represents the order in which the commands should execute for things to render properly. The commands are sorted based on their tag number into a single contiguous command buffer, which is then processed by the Rendering Thread. So a single frame will flow like this:
- Main game loop will process the window message pump and check for quit messages
- sSnatcherMain->SystemUpdate routine runs
- Game time is updated
- The main thread signals the rendering thread to start processing the rendering commands from the previous frame (ex: sorted command buffer [0])
- All game systems are updated: input, the player, AI, objects, physics, etc. queuing the updates as work items to be handled asynchronously by the worker threads
- As soon as the work items are queued the worker threads are signaled to start processing
- The object updates will add render commands to the cTrans command buffer for that worker thread
- Once all work items have been queued the main thread waits for the worker threads to process all the work items
- sRender->SystemUpdate()
- sRender notifies cTrans objects 1-4 to sort their render command list via work items
- Main thread waits until the cTrans command buffers have been sorted
- sRender coalesces all the cTrans buffers into sorted command buffer [1] (remember the rendering thread might still be working with sorted command buffer[0])
- Main thread waits for the rendering thread to complete processing of sorted command buffer [0] into a directx command buffer
- The active buffer index switches from 1 to 0, the rendering thread is signaled to start processing sorted command buffer [1], and the directx command buffer from sorted command buffer [0] is now sent to the GPU.
The last thing we need to look at is the command buffer owned by sRender that is split up and dished out to the cTrans objects. Understanding how this data structure works is the last piece before everything will fall into place.
The grossest data structure I have ever seen
Lets start with how the command buffer memory is allocated in sRender’s constructor:
|
1 2 3 4 5 6 7 8 9 10 11 12 13 14 15 16 17 18 19 20 21 22 23 24 25 26 27 28 29 30 31 32 33 34 35 36 37 38 39 40 41 42 43 44 45 46 |
class cTrans : public MtObject { ... struct RenderCommandInfo { /* 0x00 */ void *pCmdBuffer; // Pointer to the command buffer /* 0x08 */ DWORD Tag; // Tag value used to sort the commands before processing }; ... }; class sRender : public cSystem { ... /* 0x8690 */ cTrans mTrans[6]; /* 0x24B90 */ DWORD RenderBufferIndex; // Index into pRenderCommandBuffer/pSortedRenderCommands/RenderCommandCount arrays below /* 0x24B98 */ void *pRenderCommandBuffer[2]; // Buffer backing all cTrans->pCommandBuffer's /* 0x24BA8 */ cTrans::RenderCommandInfo *pSortedRenderCommands[2]; // Sorted render commands from all mTrans command buffers alloc size = 1MB /* 0x24BB8 */ DWORD RenderCommandCount; // Number of render commands in the pSortedRenderCommands buffer /* 0x24BC0 */ DWORD RenderDataMemorySize; // Size of memory allocated for render command data (pRenderCommandBuffer), 14MB ... sRender(DWORD interval, DWORD dwUnused1, DWORD dwGraphicsMemSize, DWORD dwUnused2) { ... // Set the per-frame render data memory size: // dwGraphicsMemSize = 30MB // RenderDataMemorySize = 14MB per frame allocated to pRenderCommandBuffer for all cTrans objects // Sorted render commands = 1MB per frame allocated to pSortedRenderCommands this->RenderDataMemorySize = (dwGraphicsMemSize / 2) - MEM_1MB; // Allocate the per-frame memory. for (int i = 0; i < 2; i++) { this->pRenderCommandBuffer[i] = g_pSystemHeapAllocator->Alloc(this->RenderDataMemorySize, 32); this->pRenderCommands[i] = g_pSystemHeapAllocator->Alloc(MEM_1MB, 32); } ... } }; |
The default size of memory reserved for render commands is 30MB in total, there are 2 buffers per frame context and 2 frame contexts in total. Broken down that gives 14MB/frame for all 4 cTrans objects to put commands and associated data into, and 1MB/frame to store the sorted commands. Note that the sorted command buffer only contains the cTrans::RenderCommandInfo struct seen above, all of the data associated with the command remains in the unsorted cTrans buffer. During the start of each frame the unsorted buffer for the frame interval (0 or 1 index into the buffer arrays) is split into 4 sections, one for each cTrans object:
|
1 2 3 4 5 6 7 8 9 10 11 12 13 14 15 16 17 18 19 20 21 22 23 24 25 26 27 28 29 30 31 |
class cTrans : public MtObject { ... /* 0x4B10 */ RenderCommandInfo *pCommandBuffer; // Holds render commands to be sorted before processing (buffer is allocated in sRender and reset every frame) /* 0x4B18 */ DWORD mTagNum; // Number of RenderCommandInfo entries in the command buffer /* 0x4B20 */ void *pCommandBufferEnd; // Used to allocate memory backwards for command buffer data (buffer is allocated in sRender and reset every frame) ... }; void cTrans::ResetCommandBuffer(void *pCommandBuffer, DWORD commandBufferSize) { this->pCommandBuffer = pCommandBuffer; this->pCommandBufferEnd = pCommandBuffer + commandBufferSize; this->mTagNum = 0; } void sRender::SystemUpdate() { // Calculate the per-thread render data size to give each cTrans object. DWORD perThreadRenderDataSize = (this->RenderDataMemorySize / g_sMainInstance->mJobThreadNumber) & 0xFFFFFFE0; // Initialize the memory region for each cTrans object. for (int i = 0; < g_sMainInstance->mJobThreadNumber; i++) { this->mTrans[i].ResetCommandBuffer(this->pRenderCommandBuffer[this->RenderBufferIndex] + (i * perThreadRenderDataSize), perThreadRenderDataSize); } ... } |
Looking at the sRender::SystemUpdate() function we can see that each worker thread with render capabilities (4 in total) is given a section of memory. The RenderDataMemorySize field is set to 14MB, divided by the number of worker threads that have rendering capabilities (4 in total), and rounded down the nearest 32-byte boundary, gives each cTrans object ~3.5MB of memory for rendering commands and data. You may have noticed that the cTrans object stores both the command buffer start and end addresses. When a command is added to the buffer the RenderCommandInfo structure is allocated off the pCommandBuffer pointer, and the data is allocated in a reverse fashion from the pCommandBufferEnd pointer. These pointers continuously work inwards until they eventually collapse in on each other and start overwriting data. Here is a visual representation of what these buffers look like in memory, note that all of this memory is contiguous:
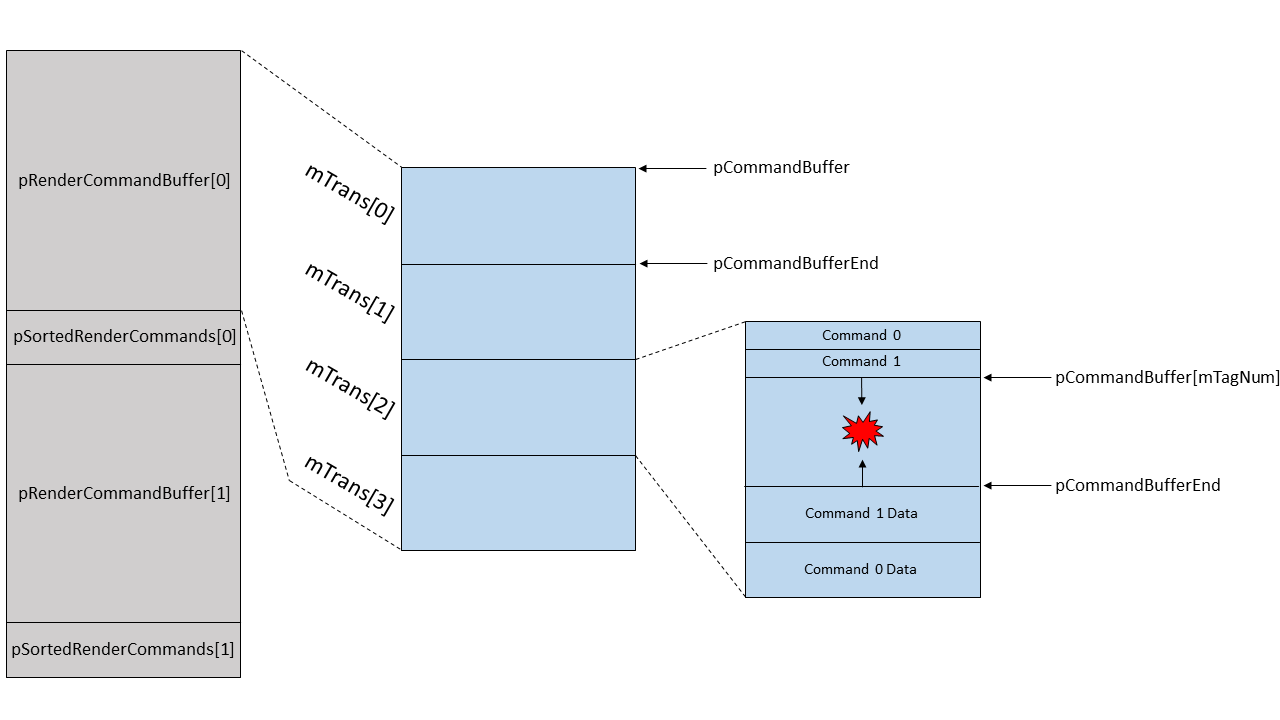
Looking at the diagram above you can see as commands are added to the cTrans command buffers the pCommandBuffer and pCommandBufferEnd pointers will work their way inward until they overlap each other and start corrupting data. In addition to that the pSortedRenderCommands buffers can also overflow and corrupt whatever data follows. This data structure is absolutely gross, but it actually gets worse. Lets jump back to cTrans::SortRenderCommands and continue our investigation of the crash.
0:003> !stack
# Child-SP RetAddr Call Site
00 000000d4e11ff6c0 00007ff7061aa8c8 cTrans::SortRenderCommands+0x35b
01 000000d4e11ff6f0 00007ff706164df0 cTrans::SortRenderCommands_0+0x28
These are the two stack frames we are interested in. Recall from the “A single frame in Dead Rising” diagram that during the sRender::SystemUpdate() function all cTrans objects will be notified to sort their render commands, that is precisely what cTrans::SortRenderCommands does. SortRenderCommands_0 is just an overload that passes some additional parameters. Here is a rough approximation of the function:
|
1 2 3 4 5 6 7 8 9 10 11 12 13 14 15 16 17 18 19 20 21 22 23 24 25 26 27 28 29 30 31 32 33 34 35 36 37 38 39 40 41 42 43 44 45 46 47 48 49 50 51 52 53 54 55 56 57 58 59 60 |
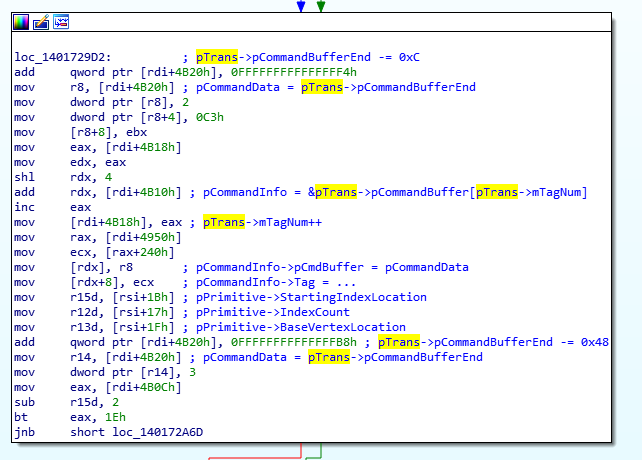
class cTrans : public MtObject { ... /* 0x4B10 */ RenderCommandInfo *pCommandBuffer; // Holds render commands to be sorted before processing (buffer is allocated in sRender and reset every frame) /* 0x4B18 */ DWORD mTagNum; // Number of RenderCommandInfo entries in the command buffer /* 0x4B20 */ void *pCommandBufferEnd; // Used to allocate memory backwards for command buffer data (buffer is allocated in sRender and reset every frame) ... }; void cTrans::SortRenderCommands_0() { this->pCommandBuffer = SortRenderCommands(this->pCommandBuffer, this->mTagNum, &this->pCommandBuffer[this->mTagNum]); } RenderCommandInfo* cTrans::SortRenderCommands(RenderCommandInfo *pCommandStart, DWORD commandCount, RenderCommandInfo *pCommandEnd) { ... // Setup the near and far pointers. RenderCommandInfo *pNearEntry = pCommandStart[1]; RenderCommandInfo *pFarEntry = pCommandEnd; // First pass: swap all elements in pairs of two. int index = 1; for (int i = 0; i < ((commandCount - 1) / 2) + 1; i++) { if (index < commandCount) { // Compare command tag values and swap accordingly. if (pNearEntry[-1].Tag > pNearEntry[0].Tag) { pFarEntry[0] = pNearEntry[0]; pFarEntry[-1] = pNearEntry[-1]; } else { pFarEntry[0] = pNearEntry[-1]; pFarEntry[-1] = pNearEntry[0]; } pFarEntry += 2; } else { pFarEntry[0] = pNearEntry[-1]; pFarEntry++; } // Next round. index += 2; pNearEntry += 2; } ... // Return a pointer to the sorted commands. return pCommandEnd; } |
SortRenderCommands uses merge sort to sort the render commands in the command buffer. The implementation above only contains the first pass of the algorithm but it is enough to see the problem. Starting with SortRenderCommands_0 we can see that the start and end pointers being passed to SortRenderCommands are pCommandBuffer and &pCommandBuffer[mTagNum], this is telling it to sort all commands in that range where mTagNum is the number of render commands in the pCommandBuffer array, basically just pointers to the first and last elements in the array. Now, merge sort needs additional memory the size of the input array to store the sorted elements as it doesn’t sort in-place. If we look at the first pass loop above we can see that pFarPointer is set to the pCommandEnd parameter (the end of the render command array). Recalling the diagram showing how the cTrans render command buffer is laid out in memory, we know that pCommandBuffer and pCommandBufferEnd work inward towards each other and have the potential to collapse in on each other. To make it worse we are now allocating another array of RenderCommandInfo structs off of pCommandBuffer which can also cause memory corruption on the data in pCommandBufferEnd.
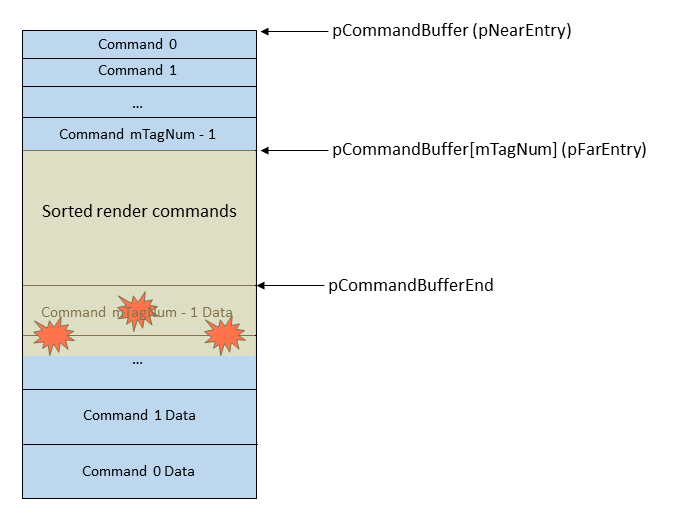
We can confirm this by checking the values of the parameters being passed to cTrans::SortRenderCommands and the return value which points to the sorted render commands. If the address of the sorted render commands + size of the array is greater than the pCommandBufferEnd address, we have overwritten the render command data and can confirm this is the source of our memory corruption issue.
DeadRising+0x68a8c3:
00007ff7061aa8c3 e8c8210000 call DeadRising+0x68ca90 (00007ff7061aca90)
0:003> rrdx
rdx=000002b8aaa01000
0:003> rr9
r9=000002b8aaa467a0
0:003> ?? **(void*)(@rcx+0x4B20)
void * 0x000002b8aaa83468
0:003> rr8
r8=000000000000457a
DeadRising+0x68a8c8:
00007ff7061aa8c8 488983104b0000 mov qword ptr [rbx+4B10h],rax ds:000002b890040040=000002b8aaa01000
0:003> rrax
rax=000002b8aaa467a0
In the first block rdx is the pCommandStart paramter, r9 is the pCommandEnd parameter, r8 is the commandCount parameter, and the void pointer is the pCommandBufferEnd field of the cTrans object (where the render command data region starts). In the second block rax is the address of the sorted render command array, it’s the same as pCommandEnd which is to be expected. The address of our SemanticIndices field that was corrupted is 000002b8aaa83afe. So if we add the address of the sorted command buffer 000002b8aaa467a0, and add sizeof(RenderCommandInfo) * mTagNum (0x10 * 0x457a) we get 000002B8AAA8BF40, which is greater than the address of our SemanticIndices field. If we subtract the pCommandBufferEnd address from the end of the sorted command array we actually overwrote and corrupted ~34KB of data. That’s a lot of memory corruption, and why I consider this data structure to be the grossest data structure I have ever seen. Now that we found the issue behind the command data memory corruption it’s time to implement a fix for it.
A temporary fix
As much as I would like to say I implemented a proper fix for this issue and it will never see the light of day again, that’s simply not the case. Unfortunately there is a large obstacle in the way that I chose to save for another day.
Here is an example of how the commands and data are added to these buffers. Anytime an object goes to add a command or data the code to allocate the needed space is inlined. There is no central function for performing the allocations. Doing some analysis in IDA I found ~314 unique places where data is allocated off the pCommandBufferEnd buffer, and each call site can have different registers and a variable amount of instructions in between where space is reserved off pCommandBufferEnd and where the new value is moved into a register to be used. I spent some time thinking about how I could eventually script discovery and hooking of these areas into a central function that would ensure the needed space is available or allocate space off a new buffer. It’s definitely doable, however, I decided to save this for a future improvement since the process is going to be quite involved. For now I came up with a more simple short term solution.
Going all the way back to the vertex/index buffer issue we fixed initially, part of the fix was to increase the initial size of the vertex/index buffer to prevent the need to resize it. With the cTrans buffers I have no easy way to re-allocate them since there is no easy way to hook all allocations from it to a single block of code that can handle that logic. However, I can increase the size of memory reserved for these buffers. There’s 30MB reserved in total for render command data, 14MB for all cTrans objects per frame context for ~3.5MB/cTrans/frame, and 1MB for sorted render commands per frame context. I doubled the memory size to 60MB in total, which gives 29MB for all cTrans objects per frame context for ~7.25MB/cTrans/frame, and 1MB for sorted render commands per frame context. The sorted command buffer hasn’t been an issue yet but I do plan to increase the size for it in the future. Implementing the fix was very simple, since the total memory size is passed as a parameter to the sRender constructor, all I had to do was hook the constructor and pass the new memory size.
|
1 2 3 4 5 6 7 8 9 10 11 12 13 14 15 16 17 18 19 20 |
sRender * __stdcall Hook_sRender_ctor(sRender *thisptr, DWORD interval, DWORD dwUnused1, DWORD dwGraphicsMemSize, DWORD dwUnused2) { // If we are running in dynamic graphics mode adjust the graphics memory size to avoid crashes. sRender *psRender = nullptr; if (ModConfig::Instance()->DynamicGraphicsMemory == true) psRender = sRender::_ctor(thisptr, interval, dwUnused1, 60 * 1024 * 1024, dwUnused2); else psRender = sRender::_ctor(thisptr, interval, dwUnused1, dwGraphicsMemSize, dwUnused2); // Initialize the imgui renderer. if (ImGuiRenderer::Instance()->Initialize() == false) { // Failed to initialize the imgui renderer. DbgPrint("### ERROR: Failed to initialize ImGuiRenderer!\n"); DebugBreak(); } // Return the sRender instnace. return psRender; } |
Testing the fix with the cursed grenade mod works perfect, the game is able to handle the large quantity of explosions and doesn’t crash. I was even able to fire off multiple cursed grenades at the same time and did not encounter any further crashes. For now this seemed good enough and the fix has been made available in DeadRisingEx v1.5.7.45.
Conclusion
Working on fixing these bugs was a lot of fun and I learned a lot about how the rendering engine for the game works. This knowledge helped me implement additional features into DeadRisingEx like the in-game console that has been made available in the latest version. Using TTD was a huge help tracking down these memory corruption issues, and I have since used it to track down an additional 13+ memory corruption issues in the vanilla version of the game. Fixes for those are also available in the latest version of DeadRisingEx. The data structure used for storing the render commands is the worst I have ever seen, seemingly endless memory corruption possibilities and not a single bounds or sanity check to be found anywhere. In the future I hope to overhaul the entire design of the render command buffers but until Dead Rising modding hits a point where crashes start reappearing I will leave it as-is for now.
You can get the latest version of DeadRisingEx here which has all of the fixes mentioned + more, and now includes a true in-game console that utilizes Dear ImGui. All of the code related to the fixes and layouts of the objects can be found here: cTrans, sRender, implementation of the fixes.