

Diagnosing Precision Loss on NVIDIA Graphics Cards
This is a short write up about how I diagnosed and debugged some precision loss issues I was encountering on NVIDIA graphics cards. The goal of this write up is to give some insight into what debugging deeply rooted rendering issues is like.
Background
I encountered this issue while working on a Halo 2 modding tool I have been developing for the past year. The goal of this tool is to be on par, if not better, than the tools that Bungie would have used to originally develop the game. Part of that is being able to render the level geometry and game models exactly as they would appear in game. For this I had written my own rendering engine which included a multi-layer shading system, a well as a JIT system to dynamically translate and recompile Xbox shaders into PC equivalents. The rendering engine was based on the actual rendering engine for the game, using several months of reverse engineering research to support it. While this would allow me to render things almost identical to how they appear in game, this also put me into an “all or nothing” situation. Since I’m using the actual game shaders for rendering and the render states are setup entirely from game data, even the smallest bug would cause havoc for what gets rendered on screen. I knew this would be an uphill battle but the end result was well worth it.
Initial investigation
After getting the initial set of bugs worked out I was able to render the first two shading layers pretty reliably with only a couple minor issues. One of which being some z-fighting that occurred on certain level mesh pieces.
At first glance I suspected the depth stencil state was incorrect or that a depth bias was not being applied, which are the typical causes of z-fighting. Because the game data I was using to setup the render state was for the Xbox implementation of DirectX 8, all of the d3d8 render states had to be recreated or emulated for d3d11 which is what my tool was based on. More than likely I was not supporting some render state correctly which leads to this issue.
When debugging graphical issues you need a graphics debugger, something like PIX, RenderDoc, or Intel Graphics Frame Analyzer. My go to is RenderDoc. From my experience it has the most fluid UI, great compatibility with different rendering APIs, and presents the information in a very organized and easy to follow way. Every graphical issue I debug starts with taking a frame snapshot in RenderDoc so naturally that was the next step.
Once I had the frame snapshot I immediately began to analyze it and inspect the render state for one of the mesh pieces that had z-fighting issues. At this time I only supported two shading layers: texaccum and lightmap. The lightmap layer is pretty self explanatory but the texaccum layer is actually a workaround for limitations in the shader pipeline on the original Xbox and will need some explaining.
The texaccum layer
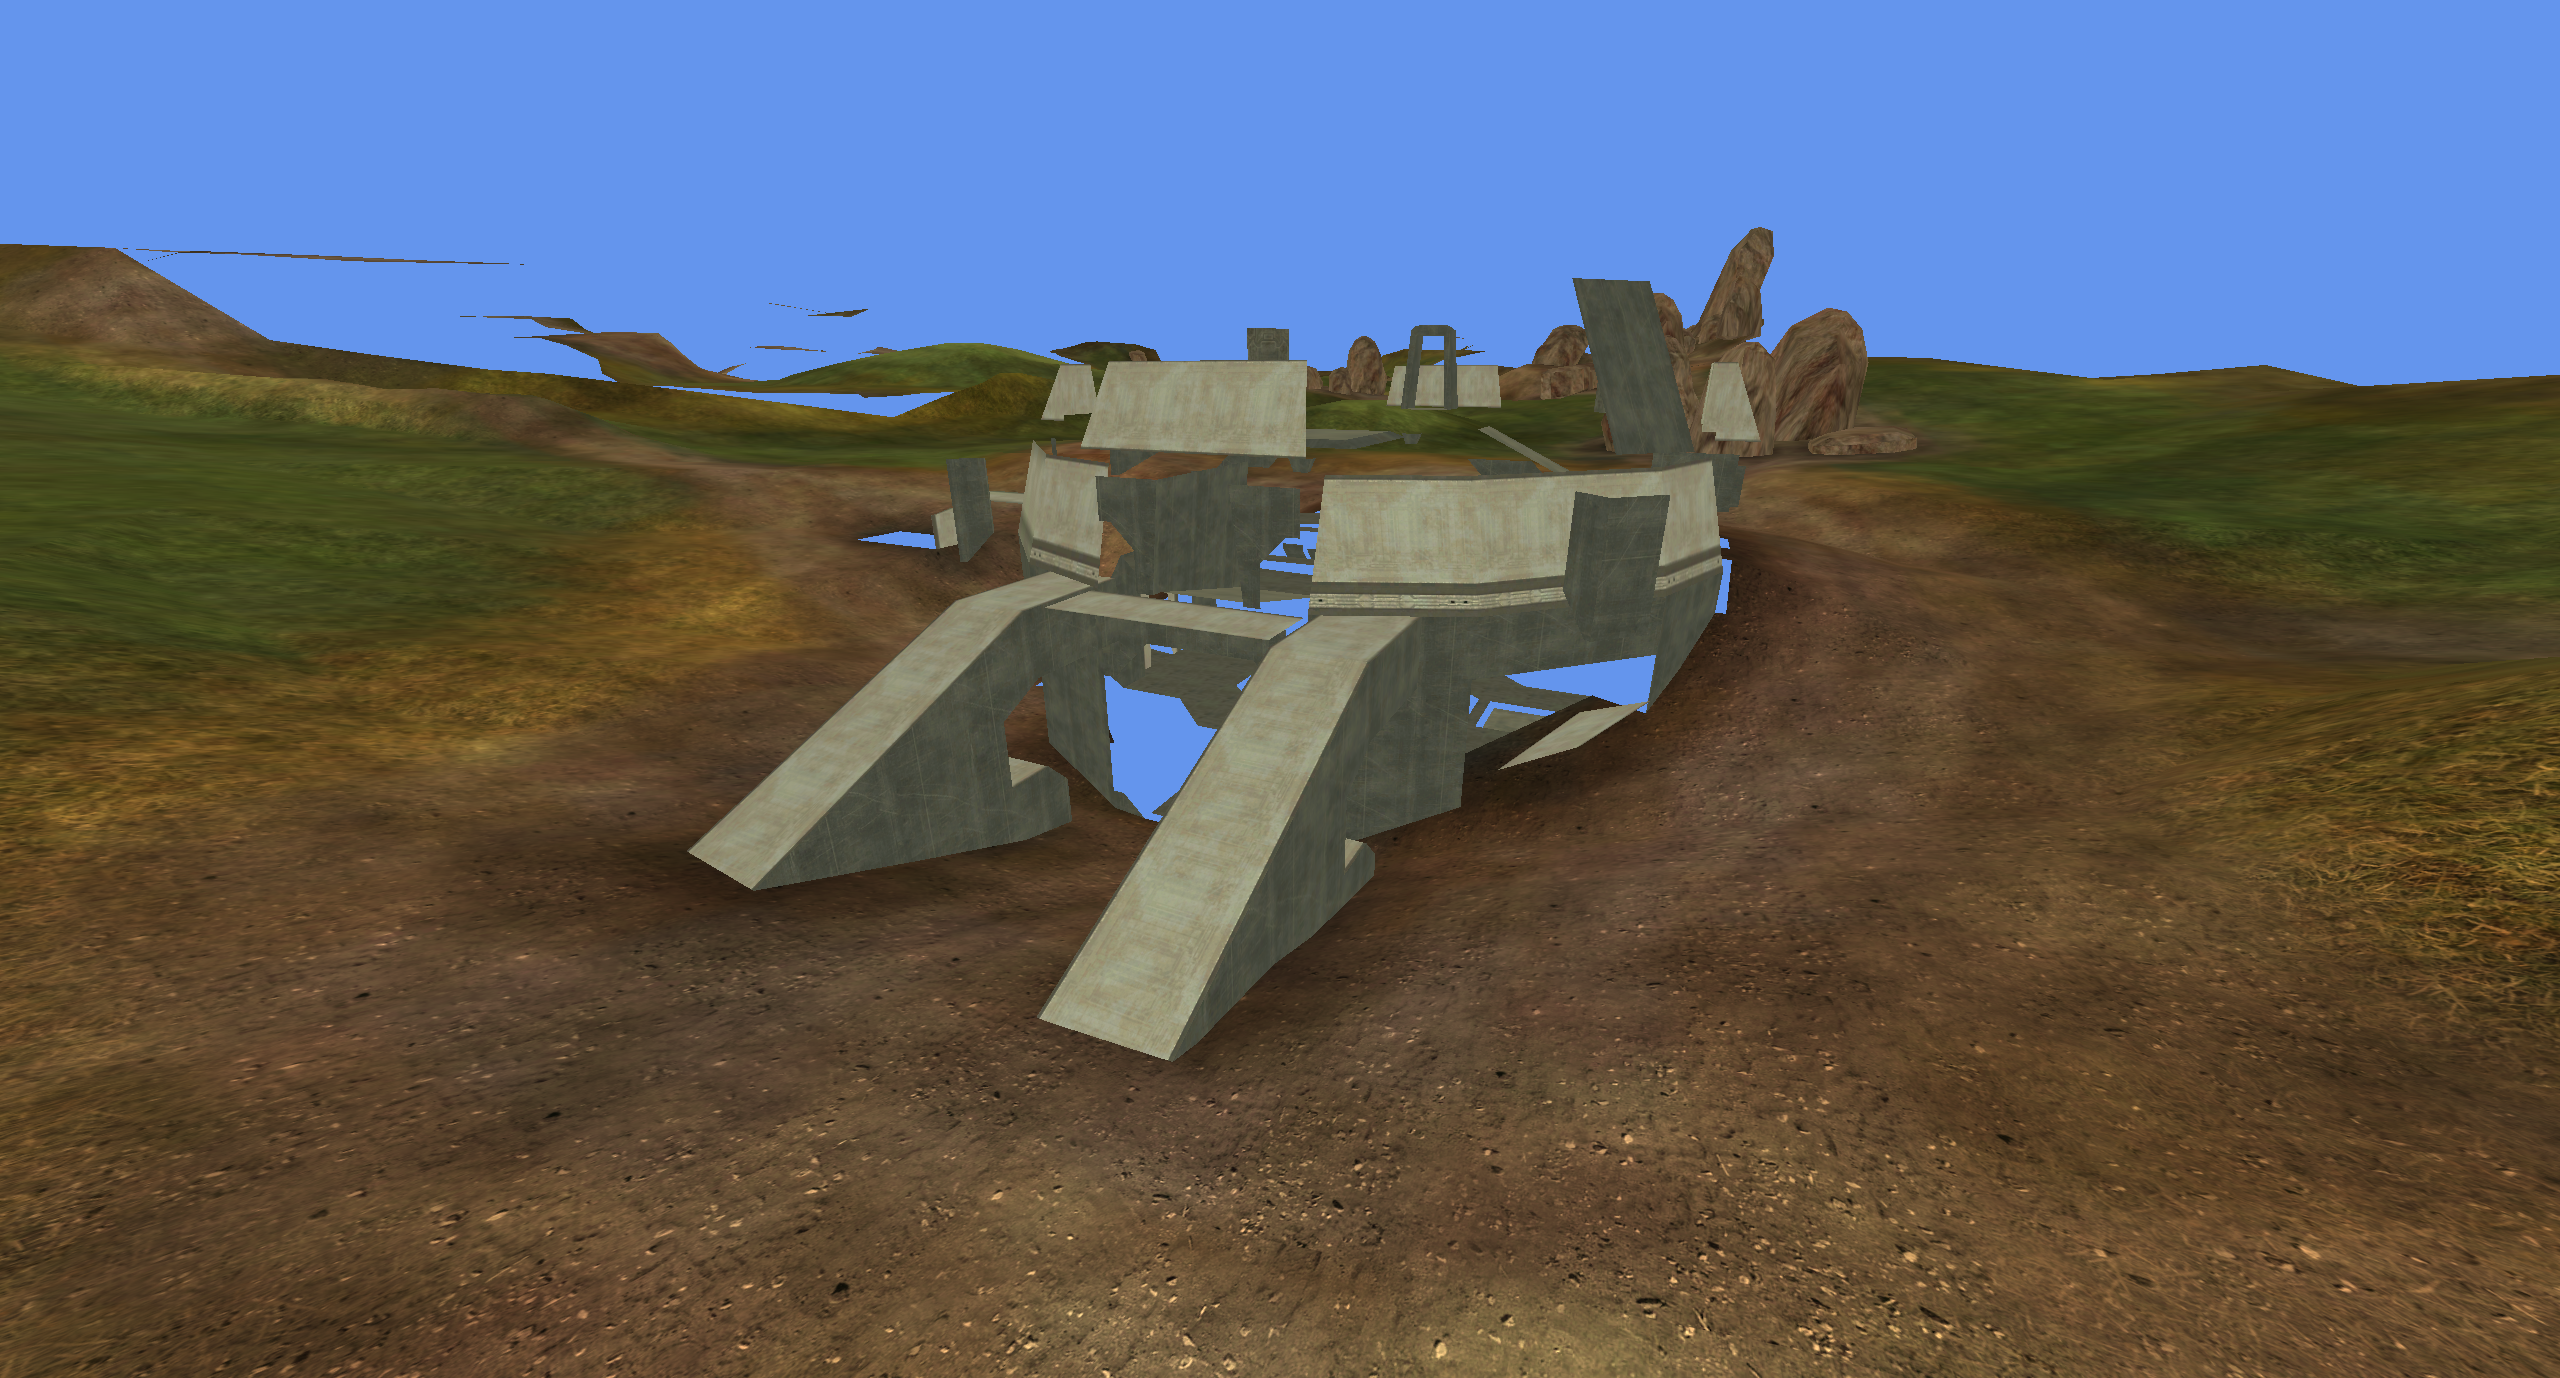
Halo uses a multi-layer rendering system with a number of layers such as texaccum, lightmap, fog, transparency, overlays, and water, to name a few. On the original Xbox console you could only sample 4 textures per pixel shader. In order to work around this and sample more textures Bungie created a texaccum, or “texture accumulator” layer. This layer has the specific purpose of sampling 2 or more textures into an output texture that can be fed into subsequent shading layers. Anything that uses more than 4 textures will first be drawn on the texaccum layer. This usually includes objects with complex base maps, detail maps, and bump maps. Once all applicable objects are drawn to the texaccum layer the output texture looks something like this:
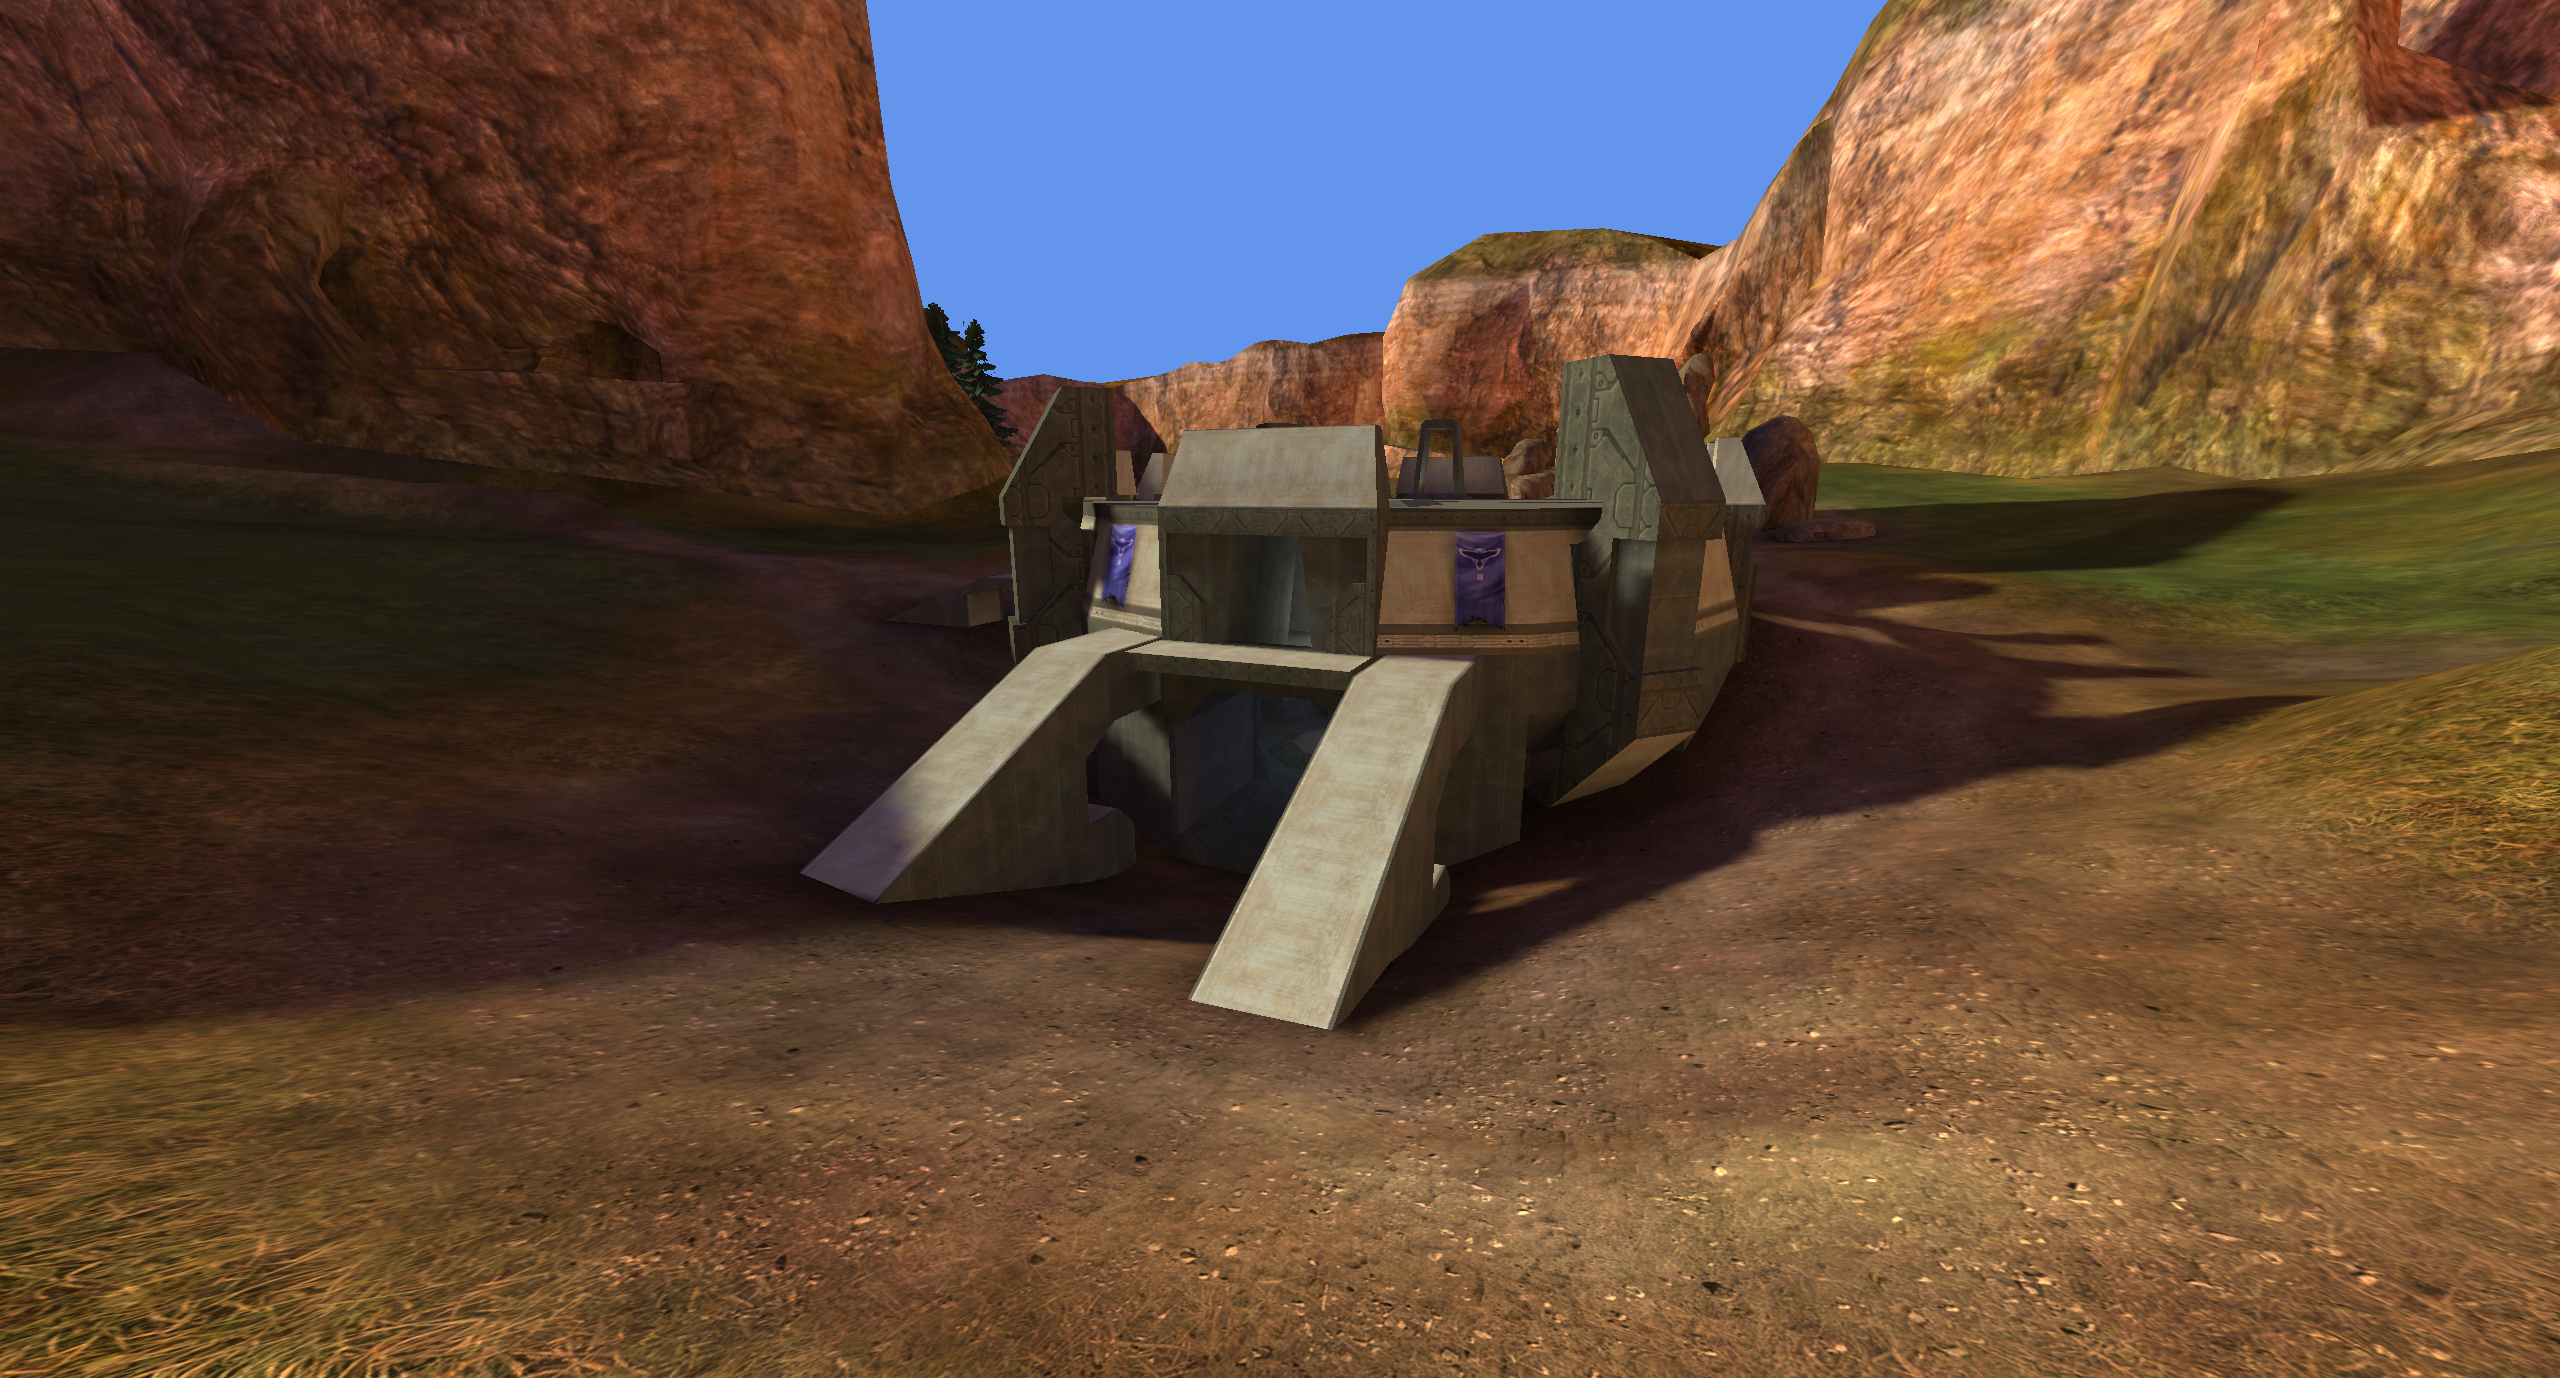
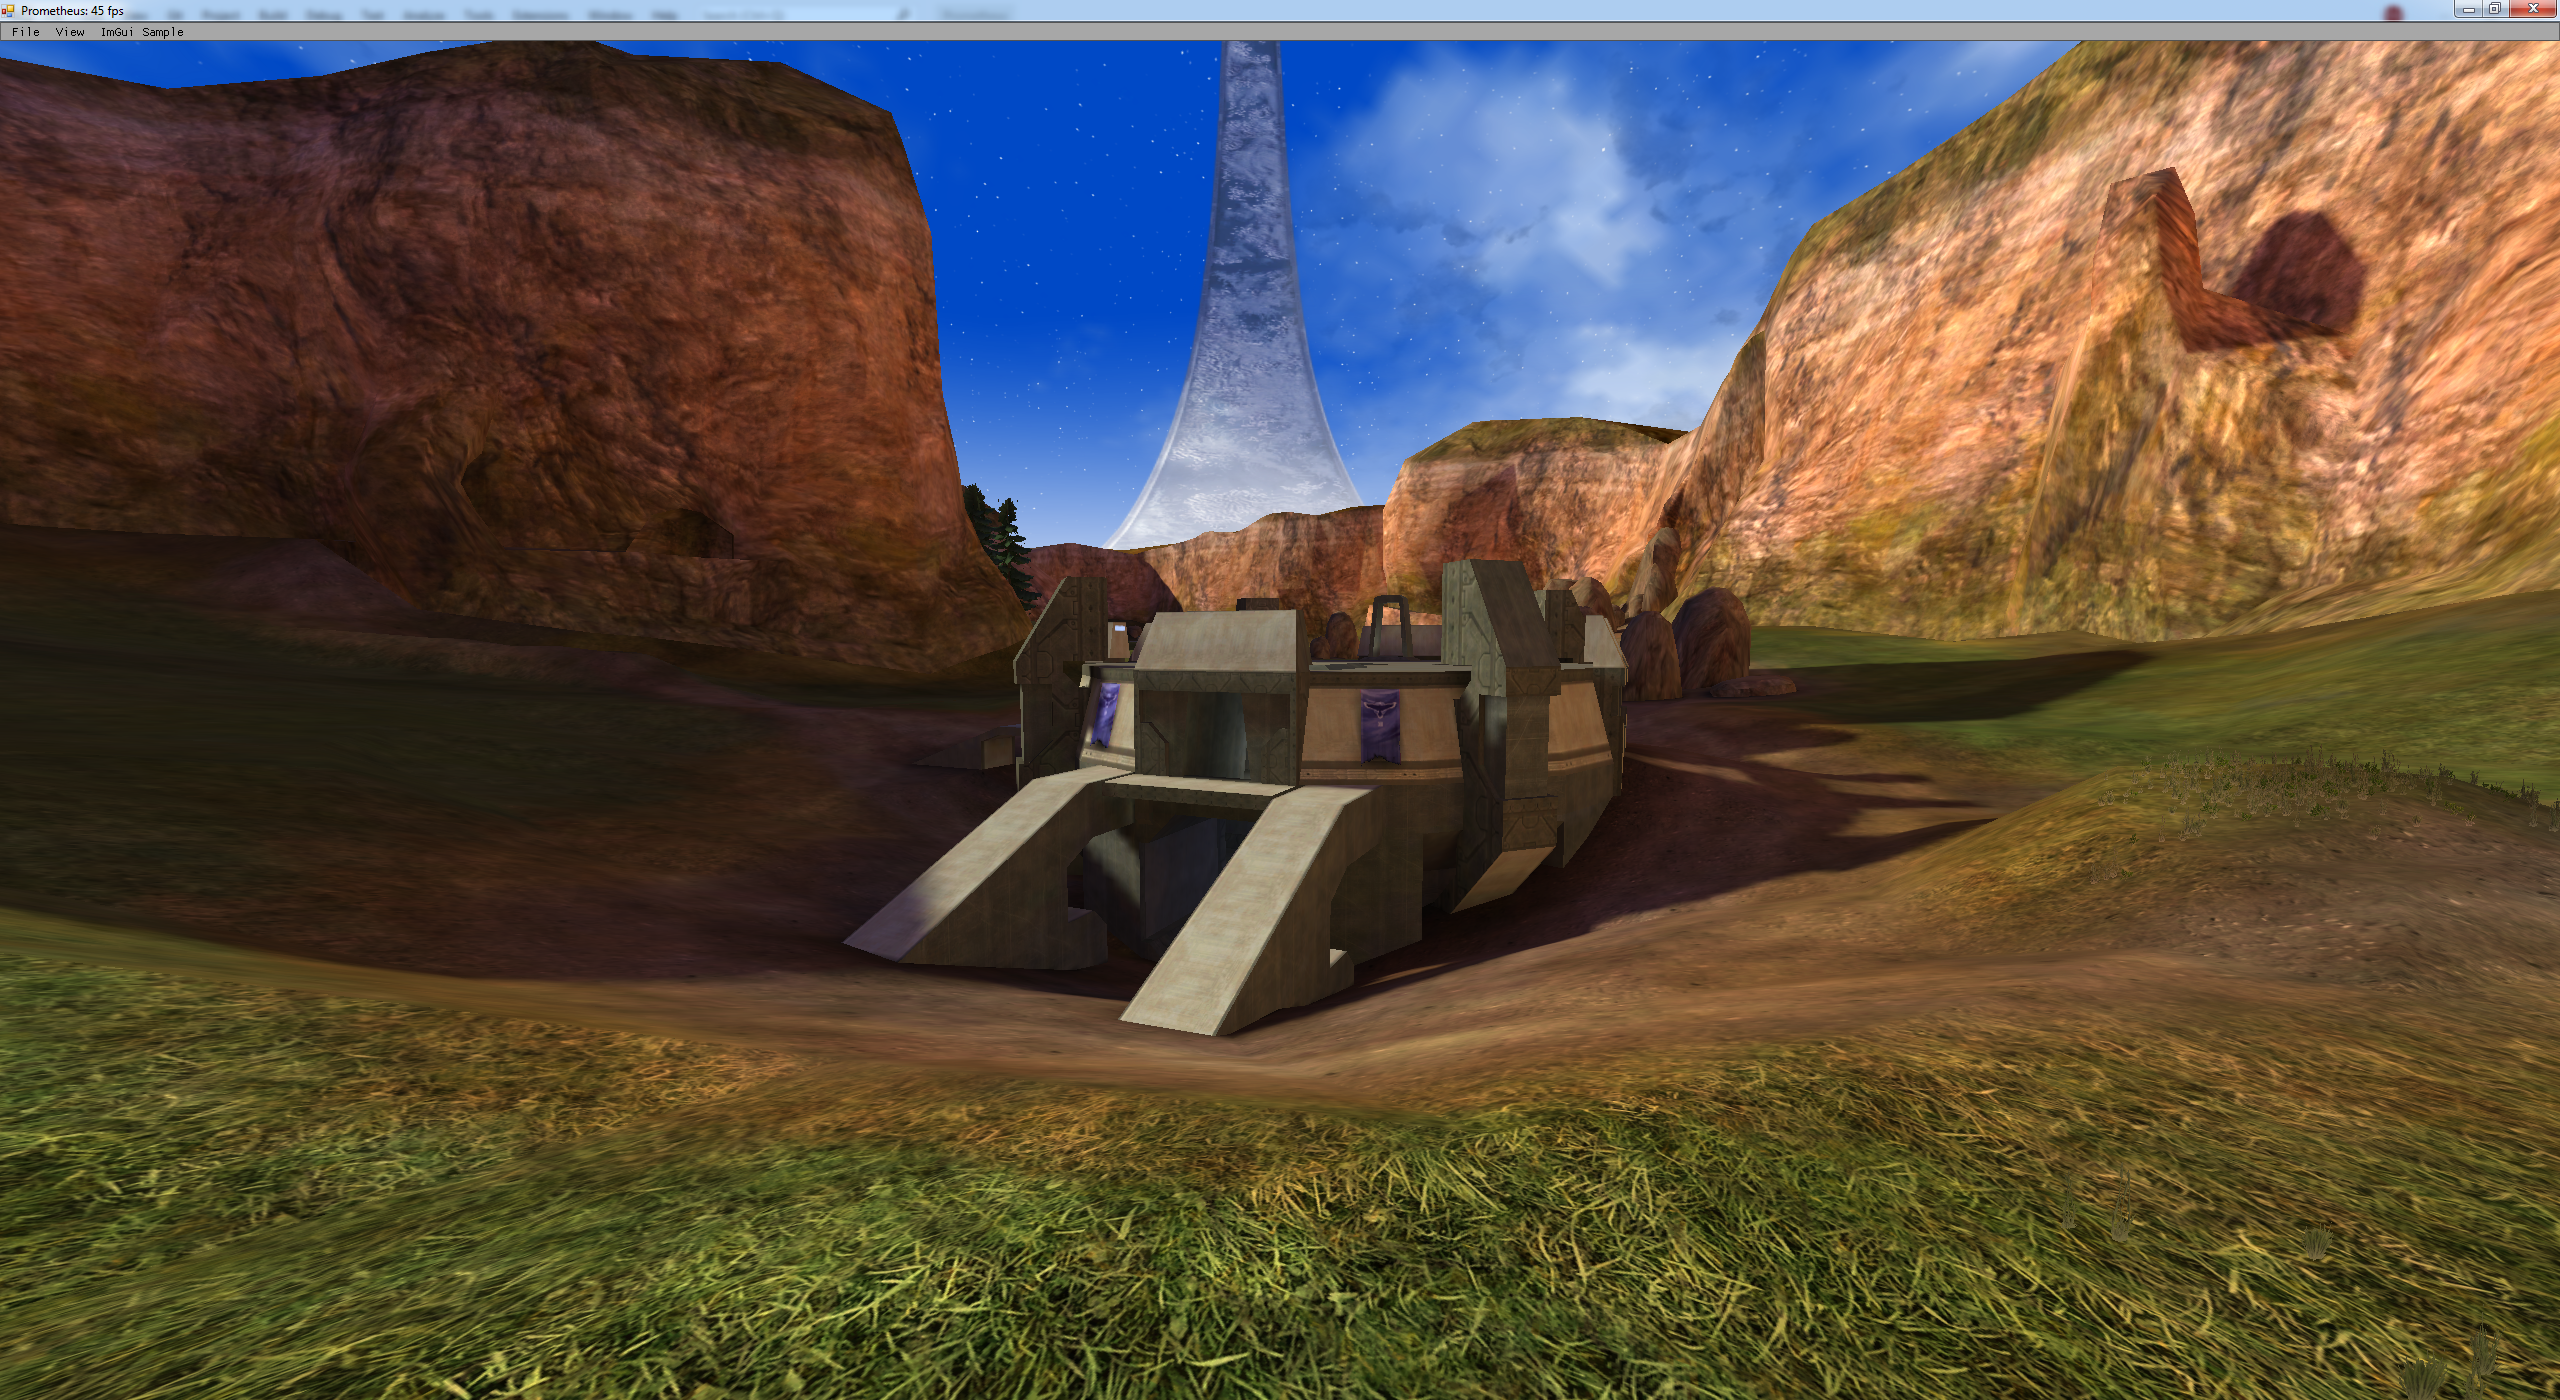
Next the lightmap layer will be rendered which will use the texaccum texture as an input. Shaders for this layer use the transformed vertex position to sample the texaccum texture and combine that pixel color with the color from the lightmap texture, and any other textures needed. Once the lightmap layer is fully rendered, the scene now looks like this (does not include z-fighting issue):
PC ports and later versions of Halo are able to sample more than 4 textures per pixel shader and don’t need the texaccum layer. But because I was working with Halo 2 for the original Xbox, I needed to support this functionality in order to render things correctly.
Analyzing the frame snapshot
With the snapshot open I began to analyze the render states for all the mesh pieces that were z-fighting and found they were all using the same technique between the texaccum and lightmap layers.
Pass 1: Texaccum
The mesh pieces were first drawn to the texaccum layer with a depth test of D3D11_COMPARISON_GREATER_EQUAL (we are using a reverse depth buffer, 0f is far plane and 1f is near plane) and depth write enabled. This pass would fill the depth buffer with the depth of each vertex and combine multiple textures into the texaccum output texture.
Pass 2: Lightmap
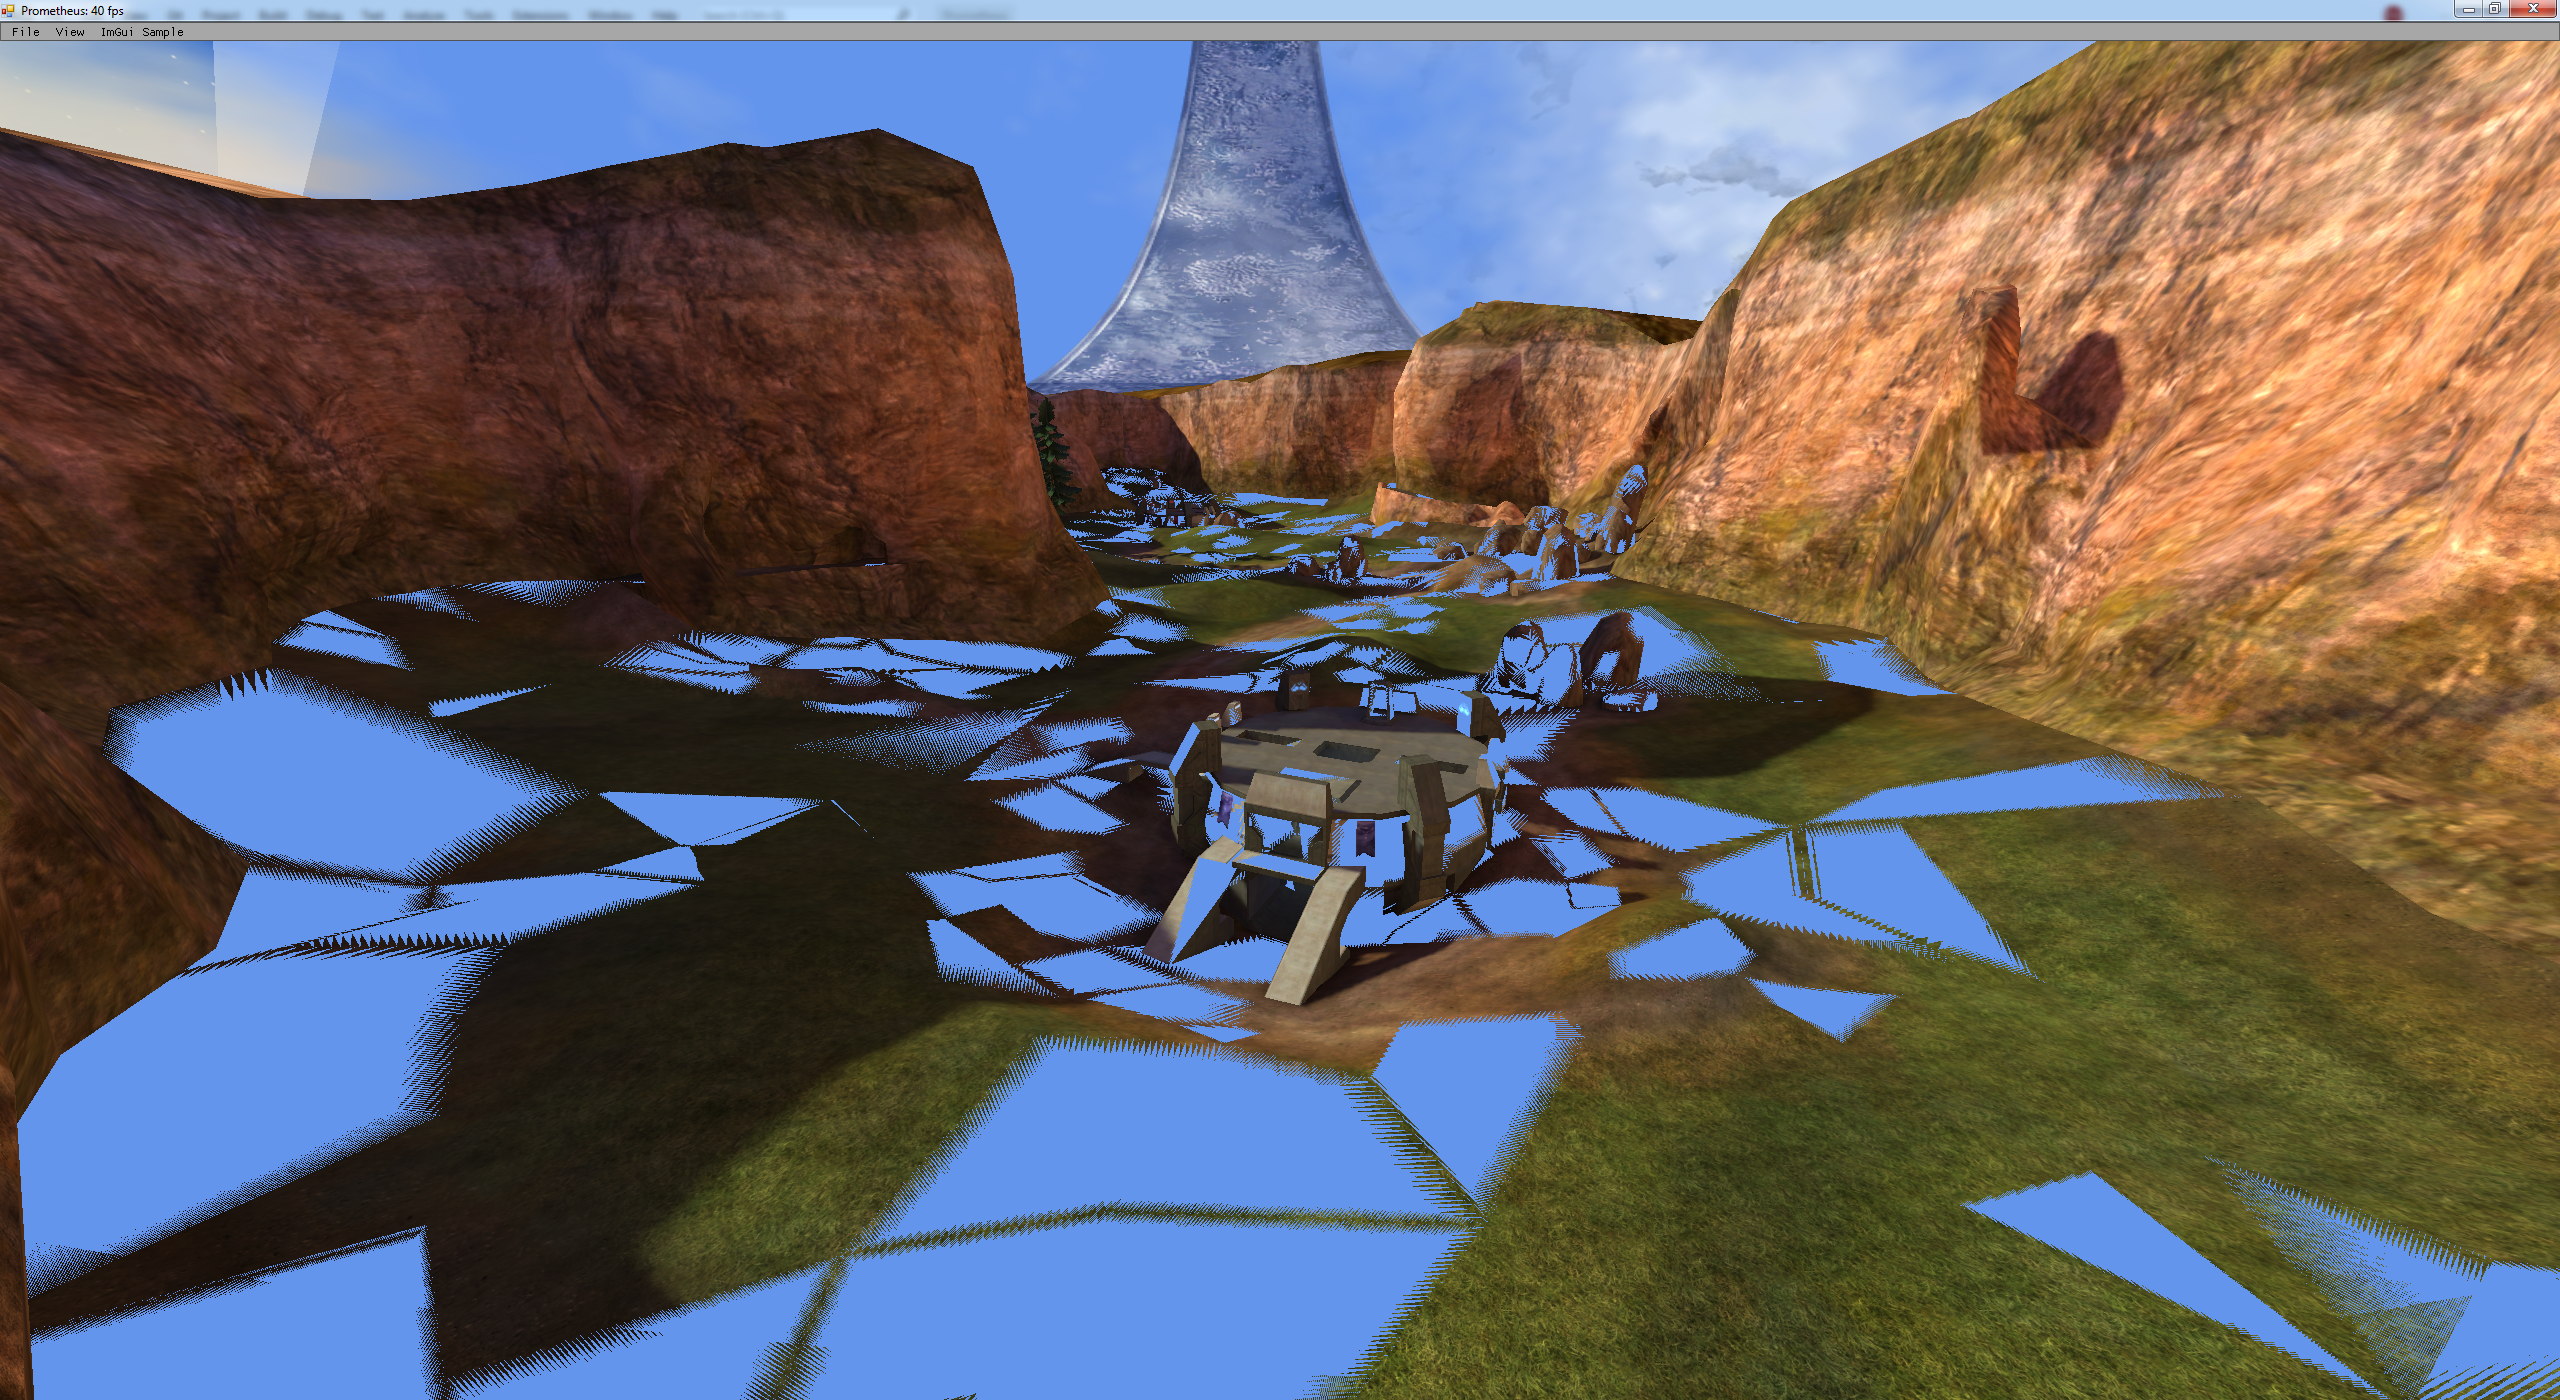
Next the same mesh pieces would be drawn to the output texture using the texaccum texture as input. The depth test for this layer was set to D3D11_COMPARISON_EQUAL and depth write was disabled. The idea here is only keep vertices which match whats in the depth buffer exactly. If you render the same mesh using the same transformation matrix and shader constants you should get the same output as before, the depth test will pass, and a new pixel value will be written to the output image. However this was not the case as we are getting z-fighting after rendering the second layer. It’s also important to note that if the depth test fails the pixel is discarded and not written to the output image, and whatever color value is currently there is what gets displayed. Since the lightmap layer renders to an output image that was cleared to cornflower blue, the resulting pixel value when the depth test fails will be cornflower blue, exactly what we see in the video.
Between the two draw calls for each mesh piece the vertex buffer is never touched, but the world-view-projection matrix and shader constants are updated and rewritten to constants buffer. I thought that maybe there was some weird precision loss occurring between calculations and decided to compare the constants buffer for both layers for a single mesh piece. Using RenderDoc I dumped the constants buffers to two files and did a binary comparison on them. Floating point comparisons can be misleading if the numbers being displayed are truncated so binary comparison is the way to go. But the buffers were the same. Next I used RenderDoc to check the depth buffer history for one of the z-fighting pixels. The pixel history shows me every depth test performed for a single pixel, the pixel color before and after the test, and the test result. This would let me see the depth comparison result for our z-fighting pixels and why they failed.
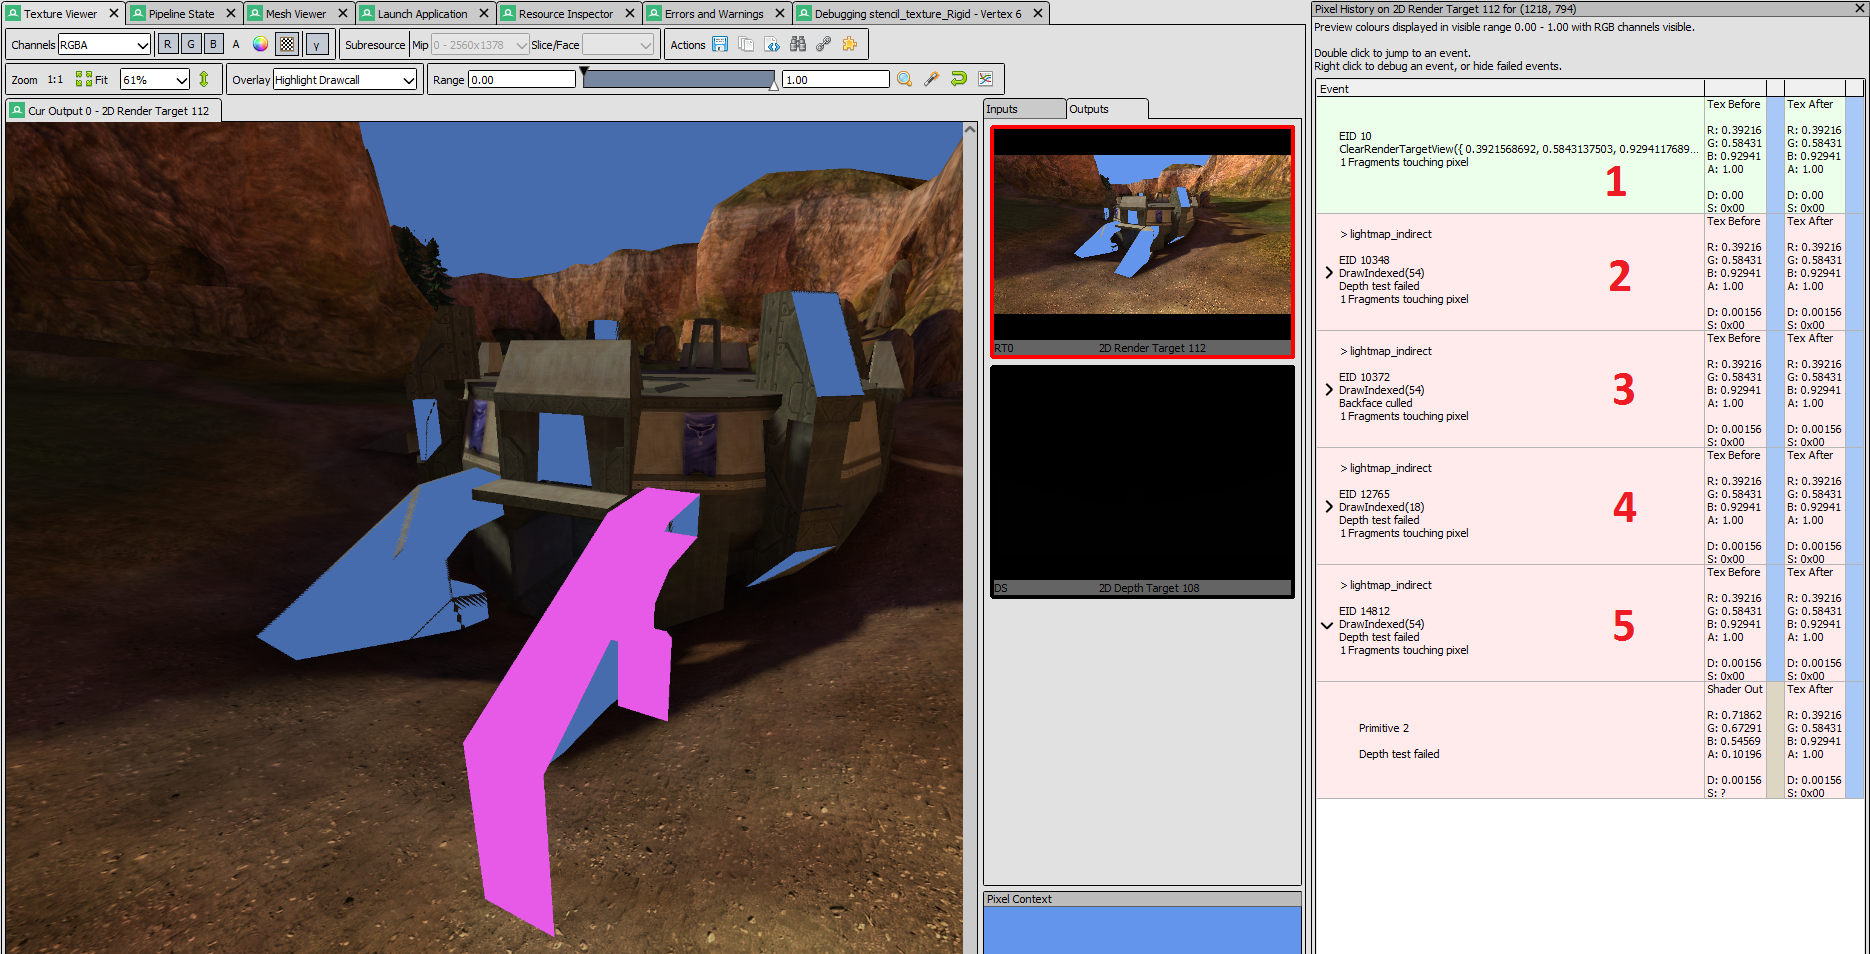
In the image above we can see the mesh piece being rendered (purple) on the lightmap layer, and the history for the one of the pixels that was z-fighting (on the right). Event #1 is the output image being cleared to cornflower blue, event #2, 3, and 4 are pixels that were discarded because they were either further away from the camera than what was already in the depth buffer, or the triangle was backfacing and culled (the triangle was facing the wrong direction). Event #5 is the one for the highlighted mesh piece that is z-fighting. We can see the output pixel color from the shader is what we would expect the mesh piece to look like, but the depth test failed and it was discarded. The other thing we can see is the depth value from the shader, 0.00156, and the value that was already in the depth buffer, also 0.00156. It appeared as though the depth values were equal and with a depth test of D3D11_COMPARISON_EQUAL this should have passed, yet it seemingly failed which should be impossible.
I thought there must have been something wrong and decided to take another snapshot, and another, and another, and another… until I realized that every snapshot and every z-fighting pixel was showing the same thing. The depth value calculated by the shader seemed to match what was in the depth buffer and yet the equals comparison was failing. At this point I didn’t know if RenderDoc was rounding the numbers being displayed (I’ll get to this in a bit), but even if it was the shaders were designed to work with this exact render state and works in the real game. I was fairly confident the render state was setup correctly as other geometry pieces were using the same render states on the texaccum and lightmap layers without z-fighting. So it seemed as though there was something else going on.
In today’s world of game design this is probably a seldomly used technique to render the same mesh twice using a depth comparison test of D3D11_COMPARISON_EQUALS for the second pass. The only reason the original game did this was because they could only sample 4 textures per pass and needed to render the mesh piece twice in order to sample more textures. This made me wonder if this could actually be hardware related, I was running on a NVIDIA RTX 3080 but what would happen if I ran this on an AMD card?
I pinged a friend on discord who had an AMD graphics card and sent him a copy of my tool. As the level geometry loaded and he panned the camera to the same area there was no z-fighting at all, absolutely none. He switched from his AMD RX 580 to a NVIDIA RTX 2060 and sure enough the z-fighting was there. That confirmed it, this was an issue with NVIDIA graphics cards. But it didn’t explain what the actual issue was or give me any idea on how to implement a fix for this.
Diagnosing hardware precision loss
The next step was to figure out what was actually going on. I assumed that RenderDoc was truncating the depth values which is why they appeared equal even though the comparison test failed. I looked in the settings window and found a setting for the number of decimal places to show for floating point values. I cranked that bad boy up to 15 and checked the depth values again. Sure enough the precision loss was clear now:
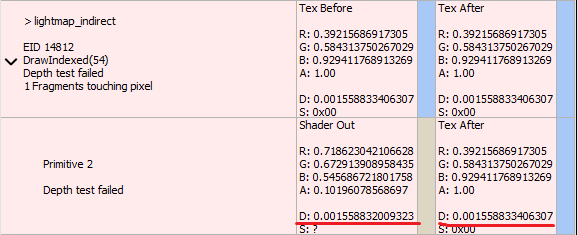
It appears as though after the 9th decimal place the values start to differ with an approximate 0.000000002 difference. Now we confirmed the precision loss but where was this manifesting from? The vertex buffer and shader constants are the same between both calls, so I figured it must be something between the shaders being used. I pulled out the lines for calculating the output vertex position (ultimately what the depth value is based on) from both shaders and compared side by side:
|
1 2 3 4 5 6 7 8 9 10 11 12 13 14 15 16 17 18 19 20 21 22 23 24 25 26 27 28 |
// mul r10.xyz, v0.xyz, c74.xyz r10.xyz = (va_position.xyz * VertexCompressionPositionMin.xyz).xyz; // add r10.xyz, r10.xyz, c75.xyz r10.xyz = r10.xyz + VertexCompressionPositionMax.xyz; // dph r0.x, r10, c-46 r0.x = dph(r10, c[50]); // dph r0.y, r10, c-45 r0.y = dph(r10, c[51]); // dph r0.z, r10, c-44 r0.z = dph(r10, c[52]); // dph oPos.x, r0, c-96 oPos.x = dph(r0, WorldTransform1); // dph oPos.y, r0, c-95 oPos.y = dph(r0, WorldTransform2); // dph oPos.z, r0, c-94 oPos.z = dph(r0, WorldTransform3); // dph oPos.w, r0, c-93 oPos.w = dph(r0, WorldTransform4); |
This code above is transforming the vertex position into the scene’s “world” view. Halo does this in two steps. First the vertex position is transformed by the model’s transformation matrix contained in c[50], c[51], and c[52]. This moves and rotates the model into the correct position in the world. Then the result is multiplied by the world-view-projection matrix contained in WorldTransform1-4 to put it into the final position relative to the camera. The “world” part of the world-view-projection matrix is just the identity matrix in this case.
As we can see both shaders are performing the same operations for calculating the vertex position, or are they? One thing that came to mind was that all of the shaders are set to be optimized when run through the HLSL compiler. Over the years I have seen optimizers do some really dirty things to code, everything from dereferencing bad addresses, to omitting return values, to just completely removing code that has important functionality. As a quick test I changed the HLSL compiler flags so that no optimizations are applied, and to my surprise that made the issue infinitely worse:
While this wasn’t the result I was hoping for this at least confirms that optimizations do play a role in how this issue manifests. I reverted the change and took another RenderDoc snapshot, this time instead of comparing the HLSL source code I compared the microcode instructions that were emitted for the compiled shaders. On the left is the output from the texaccum shader and the right is the output from the lightmap shader:
|
1 2 3 4 5 6 7 8 9 10 11 12 13 14 15 16 17 18 19 20 21 22 23 24 25 |
common.fx:216 - dph() return (a.x * b.x) + (a.y * b.y) + (a.z * b.z) + b.w; 14: dp3 r0.w, r0.xyzx, c[51].xyzx 15: add r0.w, r0.w, c[51].w 16: mul r1.x, r0.w, c[0].y 17: dp3 r1.y, r0.xyzx, c[50].xyzx 18: dp3 r0.x, r0.xyzx, c[52].xyzx 19: add r0.x, r0.x, c[52].w 20: add r0.y, r1.y, c[50].w 21: mad r0.z, r0.y, c[0].x, r1.x 22: mad r0.z, r0.x, c[0].z, r0.z 23: add r1.x, r0.z, c[0].w 24: mul r0.z, r0.w, c[1].y 25: mad r0.z, r0.y, c[1].x, r0.z 26: mad r0.z, r0.x, c[1].z, r0.z 27: add r1.y, r0.z, c[1].w 28: mul r0.z, r0.w, c[2].y 29: mul r0.w, r0.w, c[3].y 30: mad r0.w, r0.y, c[3].x, r0.w 31: mad r0.y, r0.y, c[2].x, r0.z 32: mad r0.y, r0.x, c[2].z, r0.y 33: mad r0.x, r0.x, c[3].z, r0.w 34: add r2.w, r0.x, c[3].w 35: add r1.z, r0.y, c[2].w |
|
1 2 3 4 5 6 7 8 9 10 11 12 13 14 15 16 |
common.fx:216 - dph() return (a.x * b.x) + (a.y * b.y) + (a.z * b.z) + b.w; 32: dp3 r0.w, r0.xyzx, c[50].xyzx 33: add r1.x, r0.w, c[50].w 34: dp3 r0.w, r0.xyzx, c[51].xyzx 35: dp3 r0.x, r0.xyzx, c[52].xyzx 36: add r1.z, r0.x, c[52].w 37: add r1.y, r0.w, c[51].w 38: dp3 r0.x, r1.xyzx, c[0].xyzx 39: add r0.x, r0.x, c[0].w 40: dp3 r1.w, r1.xyzx, c[1].xyzx 41: add r0.y, r1.w, c[1].w 42: dp3 r1.w, r1.xyzx, c[2].xyzx 43: add r0.z, r1.w, c[2].w 44: dp3 r1.w, r1.xyzx, c[3].xyzx |
The above instructions are the output from all the “dph” (dot product homogeneous) function calls in the shader code above. As we can see the texaccum shader used mad/add pairs and the lightmap shader used dp3/add pairs. In order to transform the vertex position into the scene’s “world” we must multiply it by the world-view-projection matrix. This is done with a series of 4 dot product calculations. But the vertex position is a vector3 and the rows of the world-view-projection matrix are vector4’s so they are not compatible. To work around this you can either create a vector4 for the vertex position and set the W component to 1, or you can do a homogeneous dot product which will ignore the missing component on one of the vectors:
|
1 2 3 4 |
float dph(float3 a, float4 b) { return (a.x * b.x) + (a.y * b.y) + (a.z * b.z) + b.w; } |
By looking at the microcode that was emitted we can start to see the issue. One transformation is using different instructions than the other which leads to some very very tiny precision loss between the two results. Given the same inputs these instruction pairs produce different outputs. Since a dot product is just a combination of mul/add/mad instructions I would think under the hood dp3 is just a combo of those and should produce the same result. But for all I know there is some special hardware path specifically for dp3, or, to add yet another layer of complexity, the microcode we see here is not what the GPU actually executes. This microcode is generated by the DirectX shader compiler and is hardware agnostic. Under the hood the graphics card drivers will actually JIT this into some hardware specific machine code, so we have no idea what this actually looks like to the graphics card itself.
I don’t know which instruction has the precision loss but I was curious to see what the emitted code looked like on a machine with an AMD graphics card, if it would be any different. I suspected not since the DirectX shader compiler operates without any communication to the graphics card drivers. Being curious I had my friend take a RenderDoc snapshot on his PC and I checked the emitted code for both shaders. Sure enough it was roughly the same code as what was emitted on my machine. The texaccum shader was using mul/add pairs and the lightmap shader was using dp3/add pairs. So this confirmed that the issue was actually precision loss on NVIDIA graphics cards in one of the add/mul/mad instructions.
*Update*
After writing this post a coworker linked me to an NVIDIA developer doc that covers precision loss for dot product calculations. It covers a few different algorithms for computing dot products and states “each algorithm yields a different result, and they are all slightly different from the correct mathematical dot product”. So this behavior of different instruction sequences for dot product calculations producing different results for a single input is by-design for NVIDIA graphics cards. The interesting part is this isn’t entirely true for AMD graphics cards. As I said in the previous section, I confirmed that the shader compiler was emitting two different combinations of instructions for the dph function in both shaders, same as I encountered on my NVIDIA setup. So AMD must have some technique they use under the hood to make the precision loss uniform between the two combinations of instructions. I would be curious to know what this technique is, but couldn’t find anything in the AMD developer documents I found on their website. If anyone has any info on this I would be interested in hearing more about it.
Optimizing the optimizer
Now that the issue is understood I need to implement a fix for this. The obvious answer might be to just add a depth bias and change the depth test to D3D11_COMPARISON_GREATER_EQUAL. However, I need to accurately detect the render state for the lightmap shader in an elegant way. Because these shaders are part of the game data that users can modify when using this modding tool, I didn’t want to implement the fix based on the shader file name. The user could just rename or clone the shader, or even create their own shader that has the same behavior. I tried to write some logic to accurately detect this render state and set a depth bias but this ended up causing issues in other shaders using the same state that didn’t have an issue. The next thing I tried was just chopping everything off after 5 decimal places hoping that it would eliminate the precision loss, but this didn’t have any affect. At least not until chopping everything off after the second decimal place, at which point the z-fighting was gone but the depth buffer was destroyed and objects just started bleeding through each other.
After sleeping on this for a few days I came back with a fresh mindset and approached the issue from a new angle. While the issue was ultimately on the hardware, the optimizer was what was pushing us down that path. If I could force the optimizer to choose one of the two paths consistently then that should mitigate the issue. Now the solution became clear, instead of calculating the dot product the long way I would use the dp3 intrinsic and a single add. This should optimize the dph function to the point where the shader optimizer wouldn’t be able to perform any further optimizations on it. If all the shaders that get compiled emit the same instructions for the dph function then they should all compute the same result for a given input. This was the new dph function:
|
1 2 3 4 |
float dph(float3 a, float4 b) { return dot(a.xyz, b.xyz) + b.w; } |
With this implemented I loaded up the level files for coagulation and voila, the issue is now “fixed”:
Conclusion
Diagnosing graphical issues can be quite tedious but with tools like RenderDoc and a proper work flow for diagnosis they can become much more manageable. Having worked through a number of rendering issues while working on this tool and others I have been able to develop a set of methodologies to quickly diagnose a number of rendering issues. This one threw me for a loop as I was expecting the issue to be something I was doing. After all, I was using a custom rendering engine which relied on JIT to translate Xbox shaders into PC format, as well as emulating DirectX 8 specific render states on DirectX 11, some of which were Xbox only extensions. I was sure the issue was something I was doing but it actually turned out to be a precision loss issue when computing dot products on NVIDIA graphics cards.
One might think this means AMD graphics cards have higher precision than NVIDIA, but that is not necessarily true. I don’t know what either card is doing under the hood. For all I know the AMD card could be truncating values before the precision loss manifests as an issue. While I wanted to do further research into this I was pretty burnt out from spending almost a weeks worth of evenings dealing with this issue. Now that I had mitigated it I decided to move on.
Minimized proof of concept
During my investigation I created a minimized poc of the issue by modifying one of the DirectX sample applications. While the poc is successful in reproducing the issue it does not have nearly the same magnitude of z-fighting as I encountered in my modding tool. The z-fighting in the poc happens very seldomly, though it is present. When I experienced it in my modding tool the z-fighting was present 98% of the time. Running the poc on a NVIDIA card will render a green cube that will periodically flicker red when the precision loss occurs. Running it on AMD cards gives no flickering as the precision loss issue is not present.
From the tests I ran these were the results:
- NVIDIA RTX 3080 – cube flickers (precision loss)
- NVIDIA RTX 2060 – cube flickers
- AMD RX 580 – no flickering (no precision loss)
- AMD RX 5700 XT – no flickering
I uploaded the source + bins to github for anyone who wants to give it a try or play around with it.
Hi,
If I’m following along correctly, this isn’t a hardware bug but instead a case where the original guest microcode produces different floating-point results than the host microcode generated by the host compiler from the HLSL that you’ve dynamically generated.
Given fadd/fmul vs fmad are going to produce different results, it seems like the fundamental issue is that you need to ensure that the compiler generates host microcode that produces the same results as the guest microcode. What does the original guest microcode look like? Is it using individual fadd/fmul or fmad ops?
In GLSL there is a precise keyword to force the compiler to treat operations consistently (so x = a * b + c would produce a fadd/fmul rather than an fmad). Perhaps there’s something equivalent in HLSL that could be used if you need to prevent the use of fused ops.
The issue isn’t that the JIT’d shaders produce different floating point values than the original xbox shaders, it’s the dp3/mad instructions do not produce the same results as add/mul. On the original xbox there is actually a “dph” instruction which I emulate via the dph HLSL function I wrote. Any place in the JIT’d shaders that call the dph function would have had a dph instruction in the original xbox microcode. I actually tried marking the variables and all associated operations using the precise keyword but this had no noticeable affect and the emitted microcode was the same as if the keyword was never used.
I definitely believe this is a GPU bug as dp3 and mad are just a combination of add/multiply operations, so regardless of what instructions are emitted the dph function should always produce the same output for a given input. Even when compiling the shaders with the “skip optimizations” flag the z-fighting was 10x worse on NVIDIA cards while there was no noticeable affect on AMD cards. If add/mul do not produce the same result as dp3 or mad then the shader compiler would never be able to optimize add/mul into dp3/mad instructions since there is no guarantee the result produced would be correct.
>as dp3 and mad are just a combination of add/multiply operations, so regardless of what instructions are emitted the dph function should always produce the same output for a given input.
This is where the confusion is coming from. This isn’t true unfortunately. When you perform say, a 32-bit floating-point multiply, a > 32-bit result will be computed. This result will normalized and rounded back down to 32-bits before getting placed in the destination register. Fused operations (aka fmad and dph) are going to perform the subsquent add with this higher-precision intermediate value and only round the final result.
Floating-point operations are generally not associative nor distributive. However, higher-level languages generally treat them as such for optimization purposes. In the GLSL manual you can find where they discuss floating-point precision –
https://i.imgur.com/hhBRKWE.png
You’ll notice that for
a * b + cit’s acceptable to be rounded once (fmad) or twice (fmul/fadd).With this all in mind, this is why converting to using the built-in
dotroutine fixed the issue. You’re starting off with the guest microcode which used a higher-precision fused operation (dph) and you need to ensure that in the end, the host microcode is using something with (hopefully) similar precision. By using dot you’re helping the compiler do so. I’m not sure of how exactly dph is implemented, but I’d be concerned with your ultimate implementation of –dot(a.xyz, b.xyz) + b.w
This may end up producing a dp3/fadd (aka two rounding operations). You may instead want –
dot(vec4(a.xyz, 1.0), b)
> You’ll notice that for a * b + c it’s acceptable to be rounded once (fmad) or twice (fmul/fadd).
This does seem to be the case. A coworker linked me to a NVIDIA developer doc that describes precision loss when computing dot products using different algorithms. They state that “each algorithm yields a different result, and they are all slightly different from the correct mathematical dot product”. So it seems that different instruction sequences used will have different results.
I still find it interesting that this doesn’t seem to affect AMD graphics cards as neither the minimized poc or the larger tool I’m developing show any z-fighting on AMD cards. They must have some technique they use under the hood to keep any precision loss uniform, but I couldn’t find anything about it in the developer docs I found on their website.